EventCatalog already gives you auto-generated visualizations: Entity Maps, Interaction Maps, and domain views that update as your catalog changes. These are great for understanding relationships between your resources.
EventCatalog already gives you auto-generated visualizations: Entity Maps, Interaction Maps, and domain views that update as your catalog changes. These are great for understanding relationships between your resources.
But sometimes you need your own diagrams. Target architecture plans. Event storming results. Sequence flows from Miro. C4 diagrams from IcePanel. The stuff that lives in scattered boards, Confluence pages, or that folder someone created two years ago.
EventCatalog 3.3.0 lets you bring those diagrams to your documentation.
Your custom diagrams are now first-class, versioned resources in your catalog. Bring them in from any tool, version them, link them to your domains and services, and even ask AI about them.
What's new?
You could already embed diagrams from tools like Miro, IcePanel, and Lucidchart into your documentation pages. That's still fully supported.
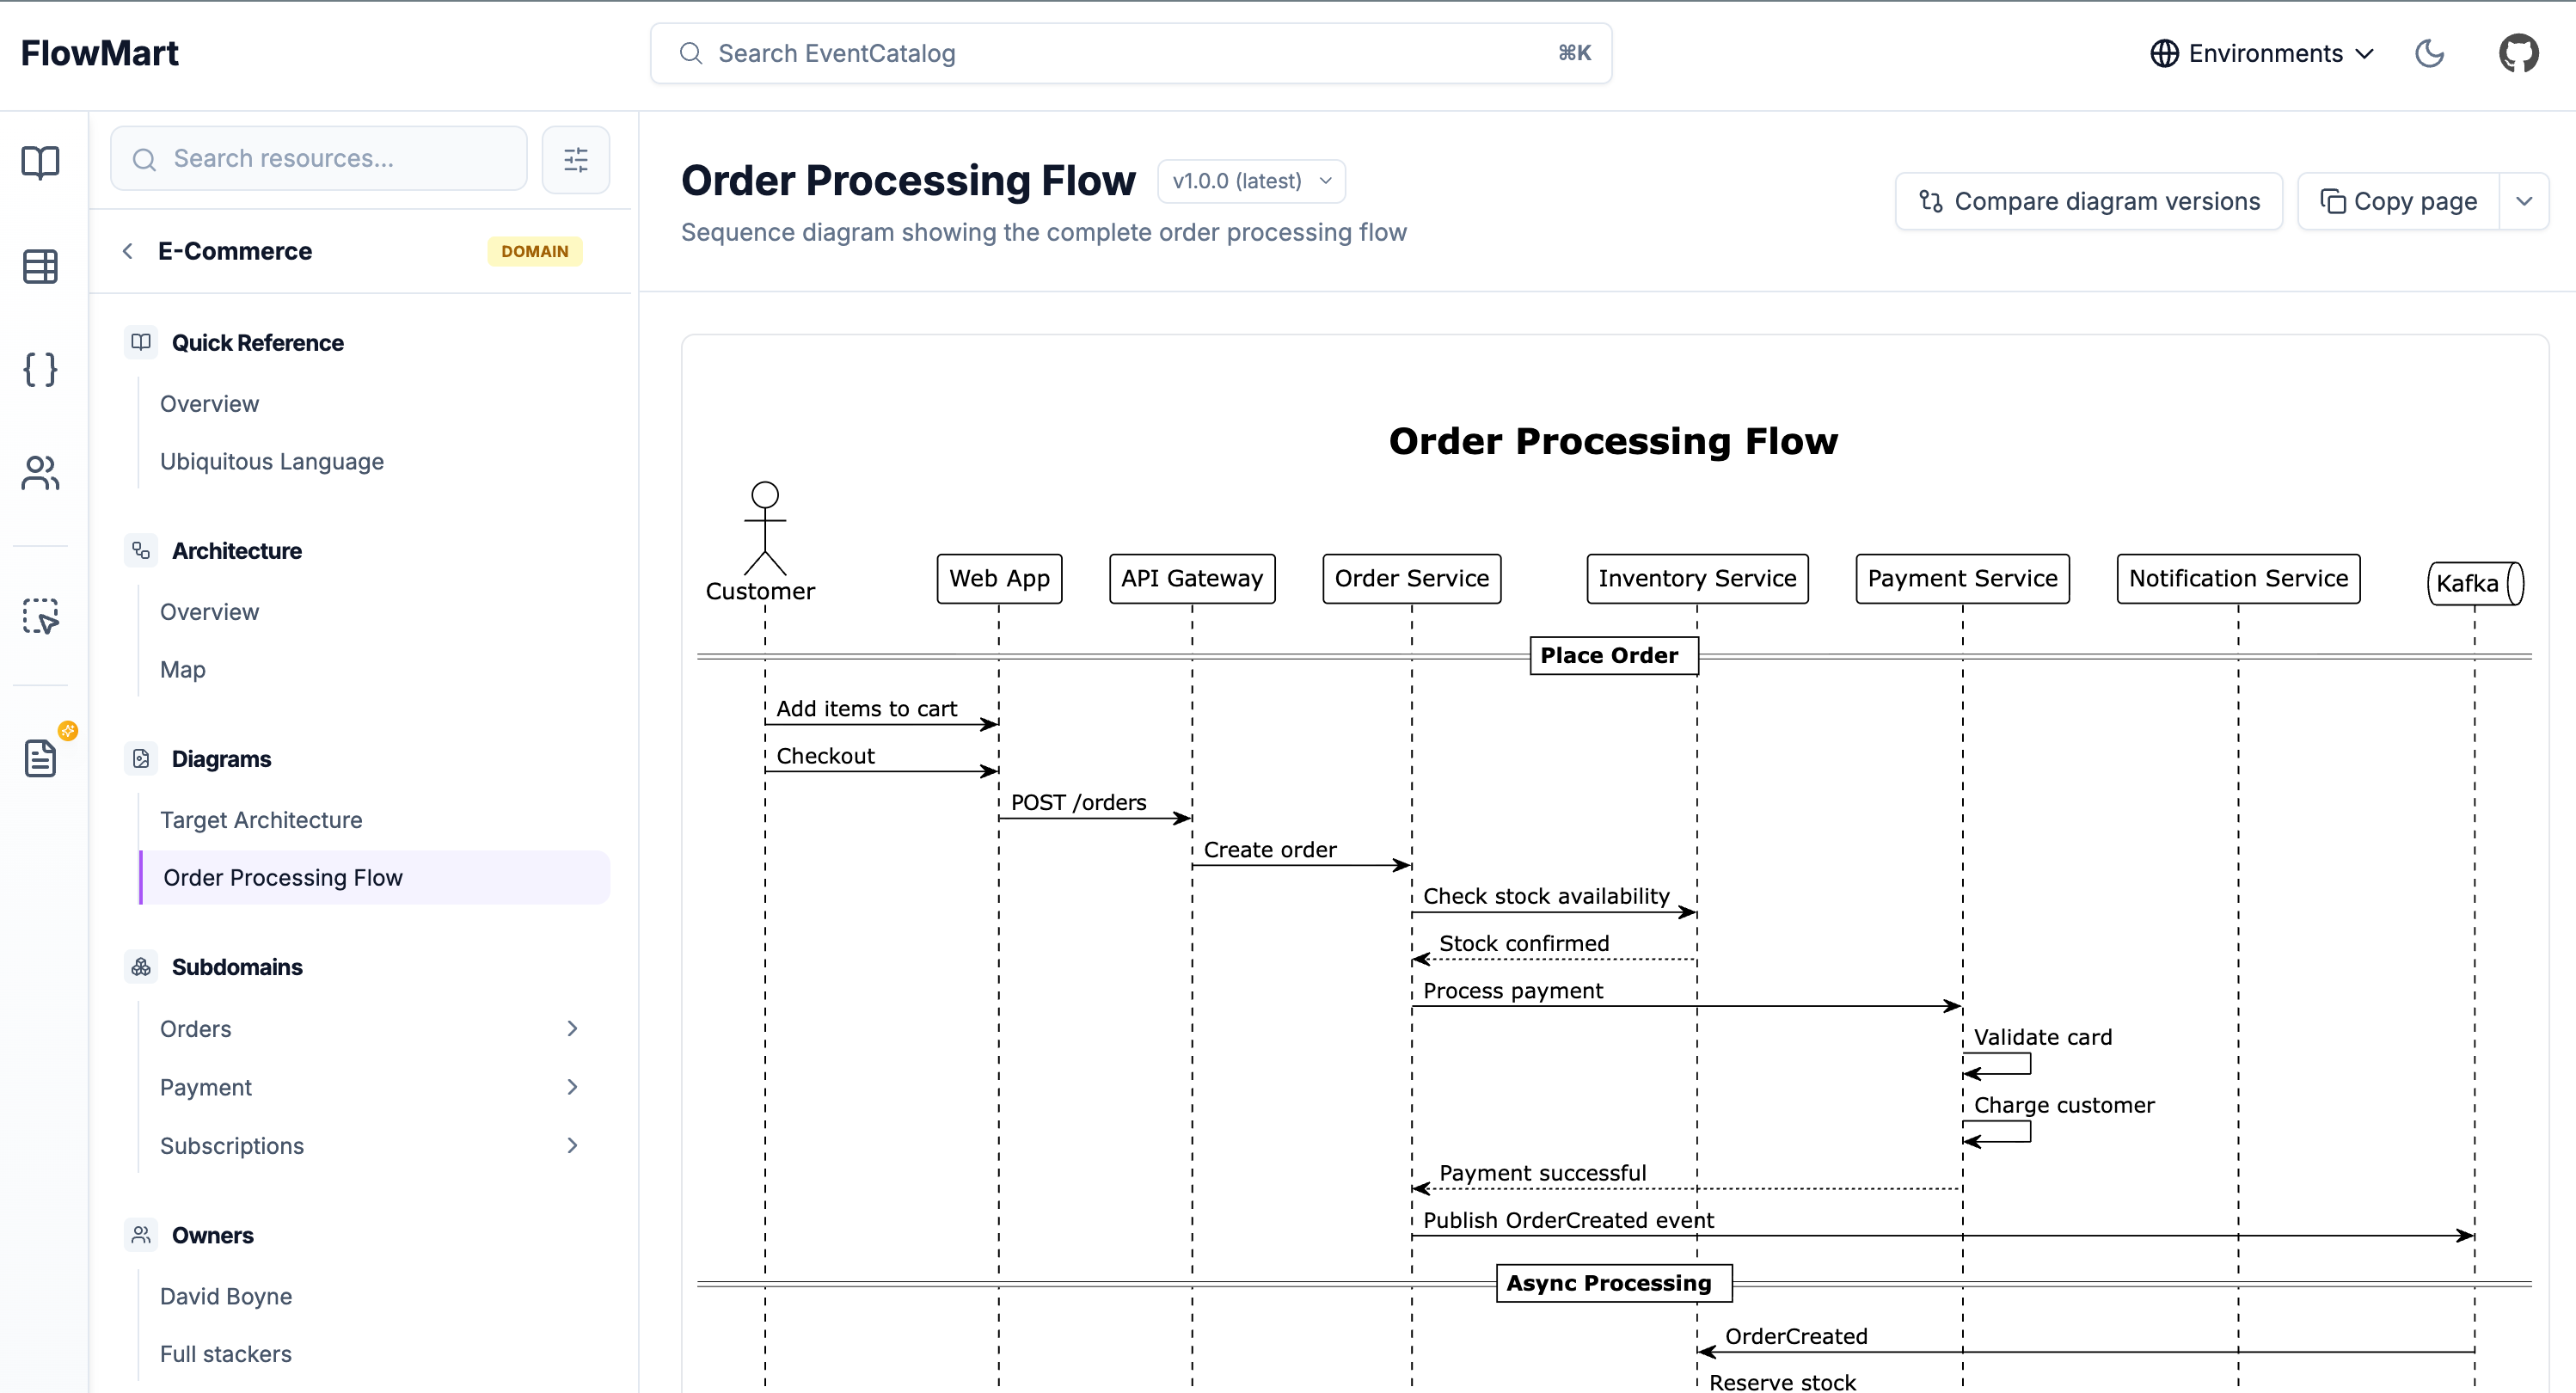
Now, diagrams can be standalone resources with their own dedicated pages:
- Versioning: Track how your architecture evolves over time
- Version comparison: See what changed between versions (Scale)
- Cross-references: Link diagrams to domains, services, messages, and containers
- LLM support: Every diagram is accessible via
.mdxendpoints for AI tools - Interactive controls: Zoom, pan, and copy diagram code (e.g Mermaid, PlantUML) for better viewing and exploration
 Example of PlantUML diagram
Why this matters
Get more value from your documentation by bringing your diagrams into EventCatalog. Version them alongside your domains, services, and messages. Link them to the resources they describe.
A common use case: document your current architecture as v1.0.0 and your target architecture as v2.0.0. Teams can switch between versions and see exactly where you're headed. No more hunting through Confluence or asking "where's that architecture diagram?"
How it works
Creating a diagram
Diagrams can live anywhere in your catalog. Put them at the root level for system-wide diagrams, or nest them within domains and services for resource-specific visualizations:
# Root level (system-wide diagrams)
/diagrams/target-architecture/index.mdx

# Nested within a domain
/domains/Orders/diagrams/order-flow/index.mdx

# Nested within a service
/services/PaymentService/diagrams/payment-sequence/index.mdx
Use root-level diagrams for cross-cutting concerns like target architecture or system context. Nest diagrams within resources when they're specific to that domain or service.
Add frontmatter and your content:
---
id: system-architecture
name: System Architecture
version: 2.0.0
summary: Target microservices architecture
---
Then add your diagram content. Use code blocks for Mermaid or PlantUML, or use EventCatalog's built-in components like <Miro>, <IcePanel>, <Lucid>, or <FigJam>. It's up to you.
```mermaid
graph TB
    Gateway[API Gateway]
    OrderService[Order Service]
    Gateway --> OrderService
```

<!-- Bring your miro board here -->
<Miro url="https://miro.com/app/board/abc123" />

<!-- Or bring IcePanel diagrams to your docs-->
<IcePanel diagramId="your-diagram-id" landscapeId="your-landscape-id" />
Versioning
All diagrams can be versioned using EventCatalog's built-in versioning feature.
Old versions live in a versioned folder:
/diagrams/
  └── system-architecture/
      ├── index.mdx           # v2.0.0 (latest)
      └── versioned/
          └── 1.0.0/
              └── index.mdx   # v1.0.0 (monolith)
Users can switch between versions using the dropdown in the header.
Referencing from resources
Link diagrams to any resource using the diagrams field:
---
id: E-Commerce
name: E-Commerce Domain
version: 1.0.0
diagrams:
  - id: system-architecture
    version: 2.0.0
  - id: checkout-flow
---
The diagrams appear in the resource's sidebar, keeping everything connected.
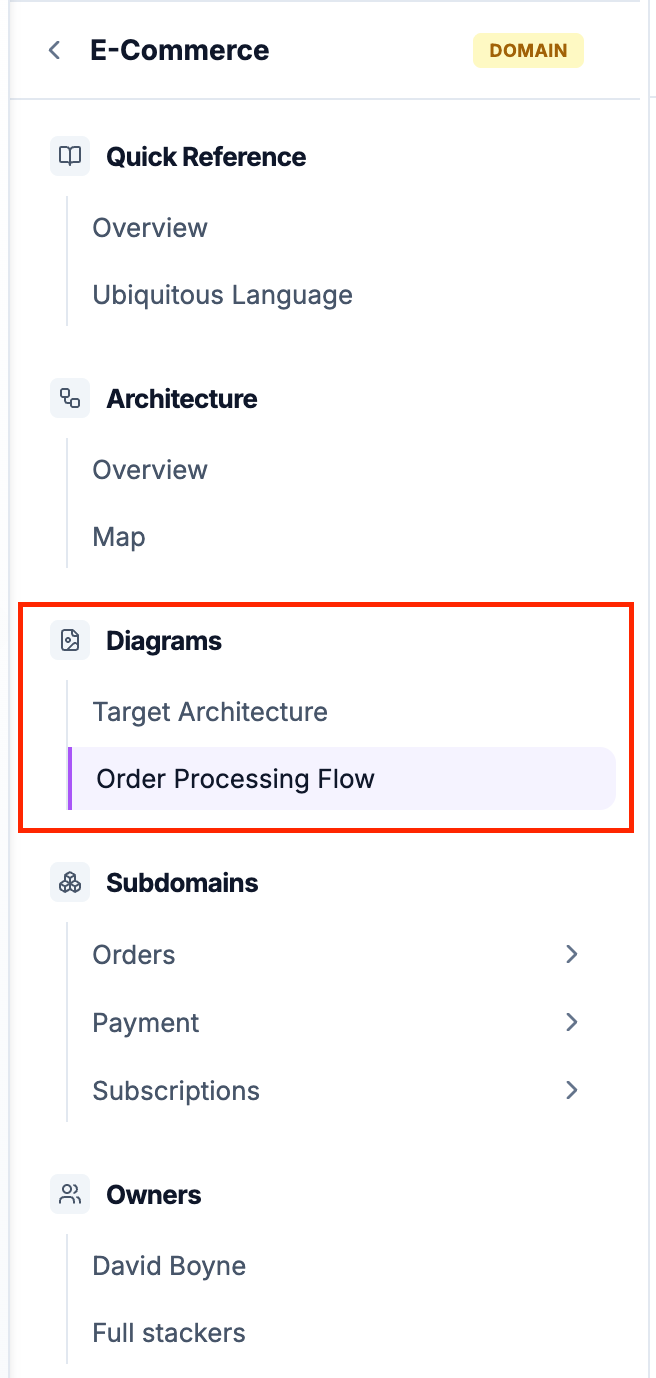 Example of diagram sidebar
Comparing versions
With EventCatalog Scale (requires a license), compare diagram versions side-by-side. Perfect for architecture reviews and migration planning.
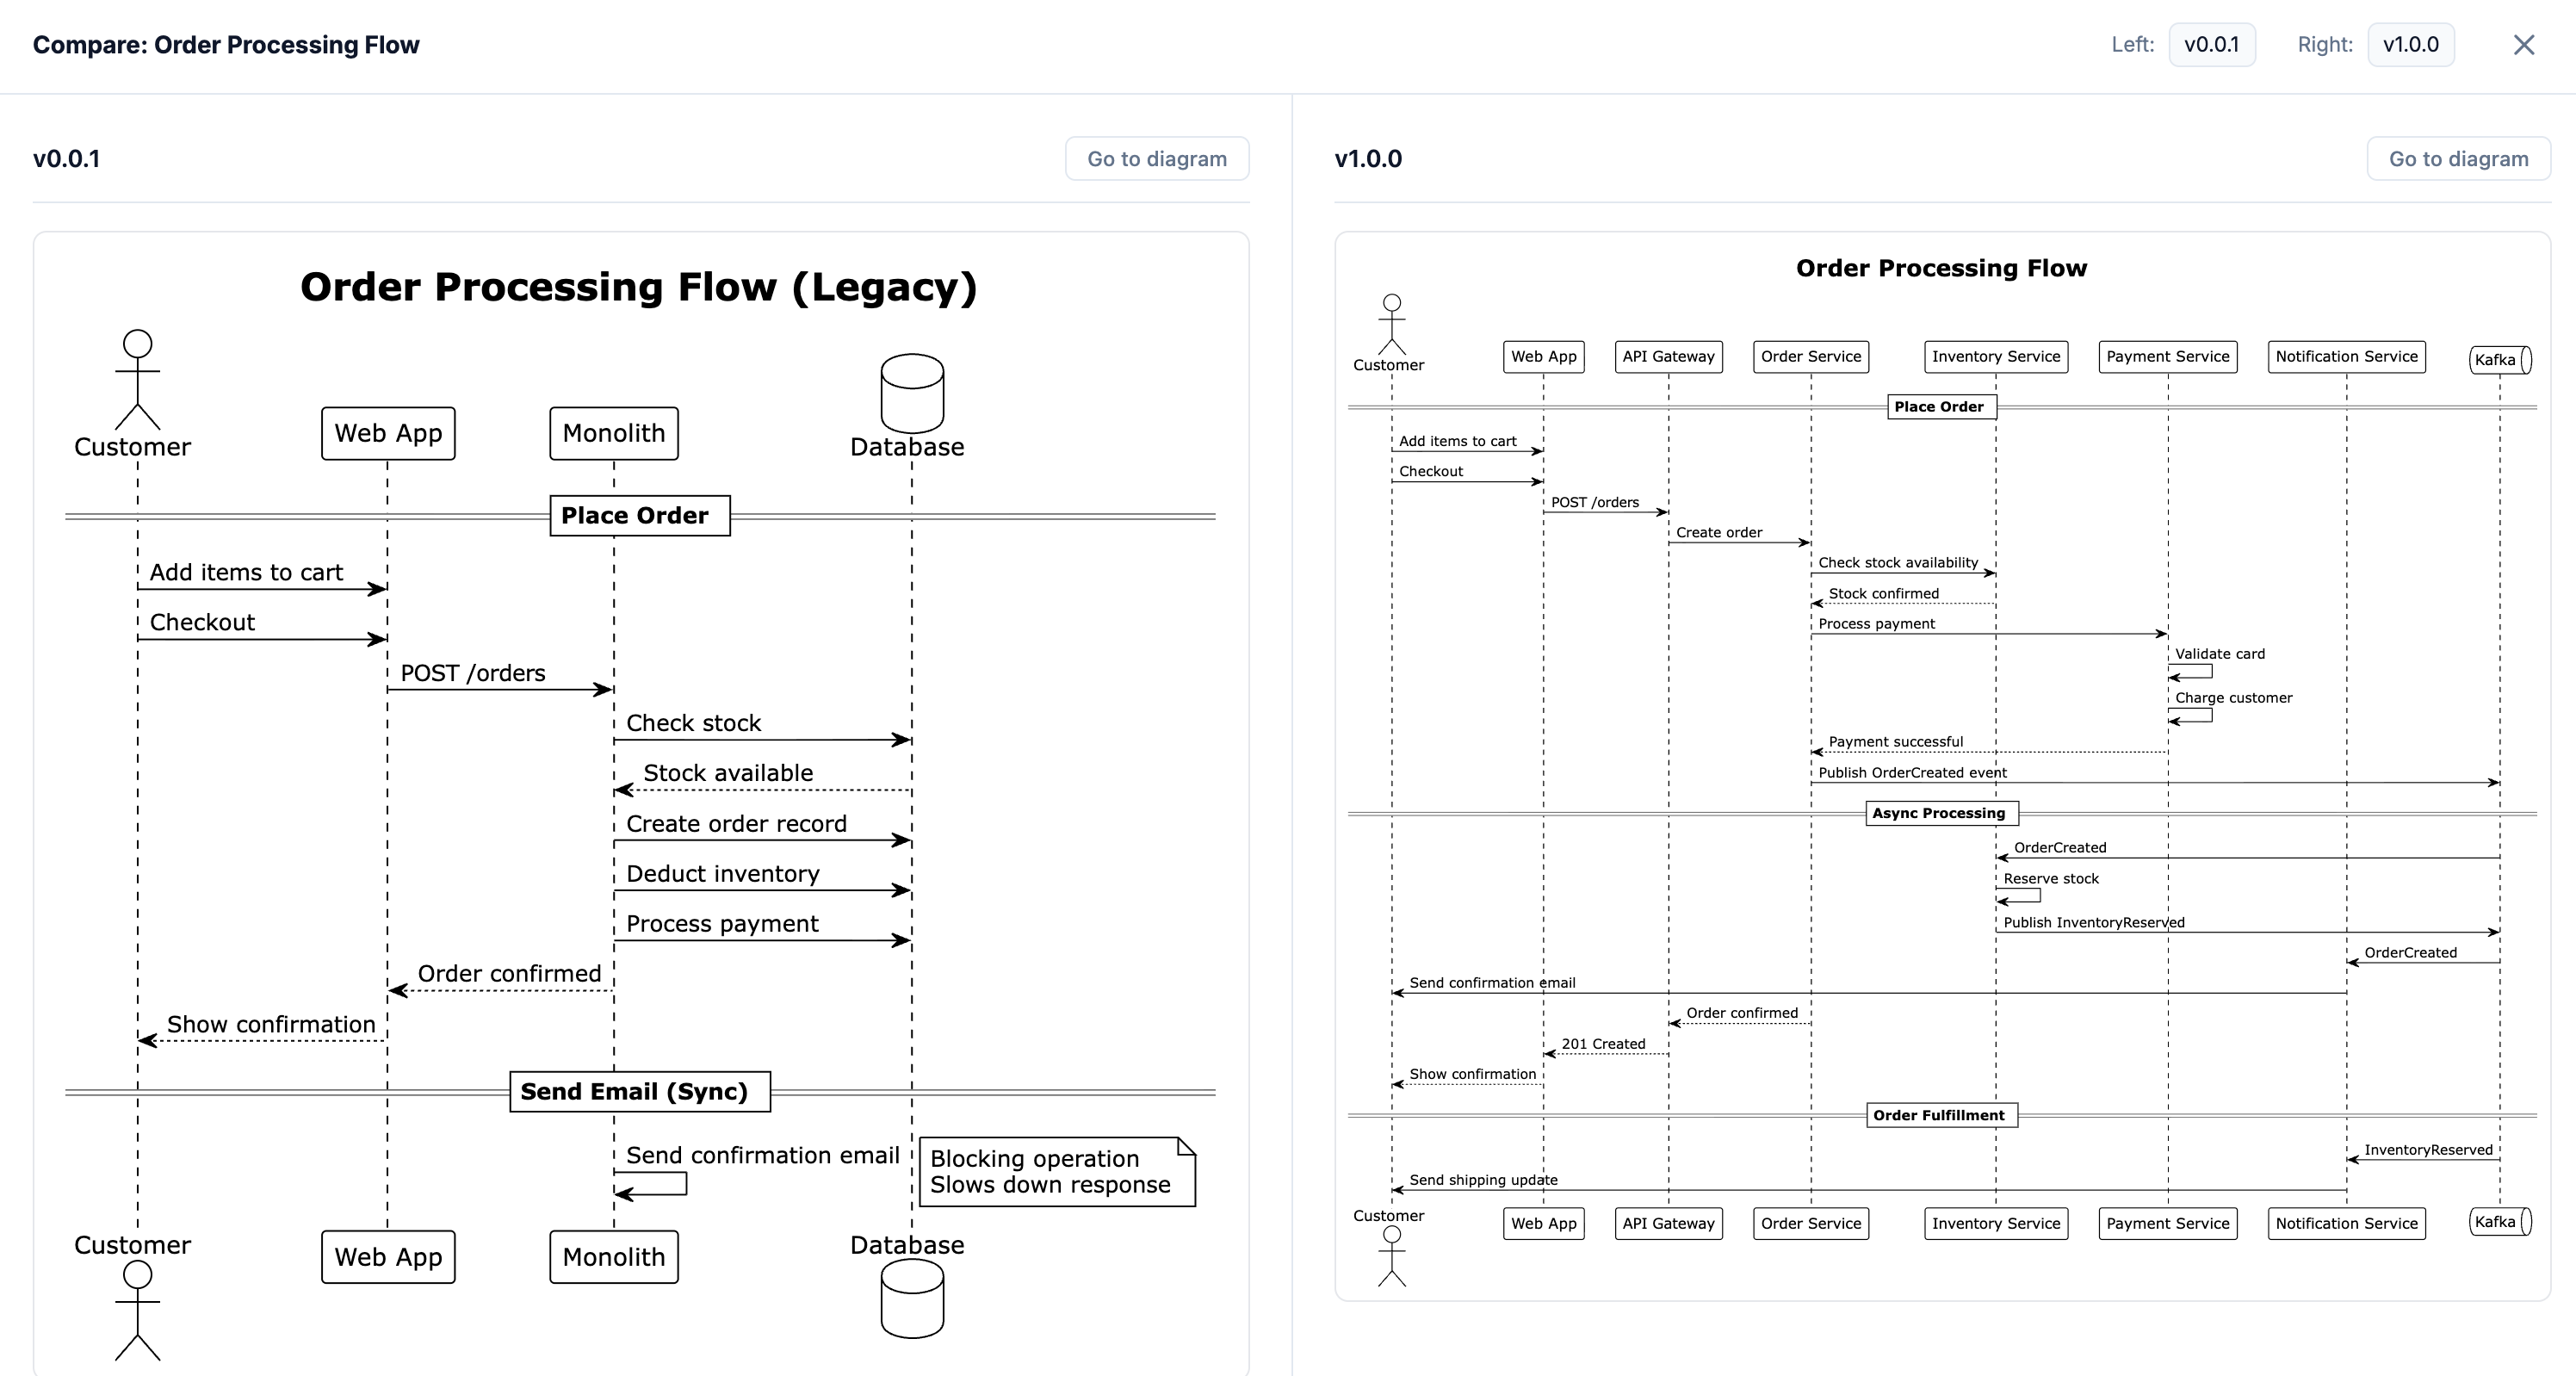 Example of diagram compare
New diagram interactive controls
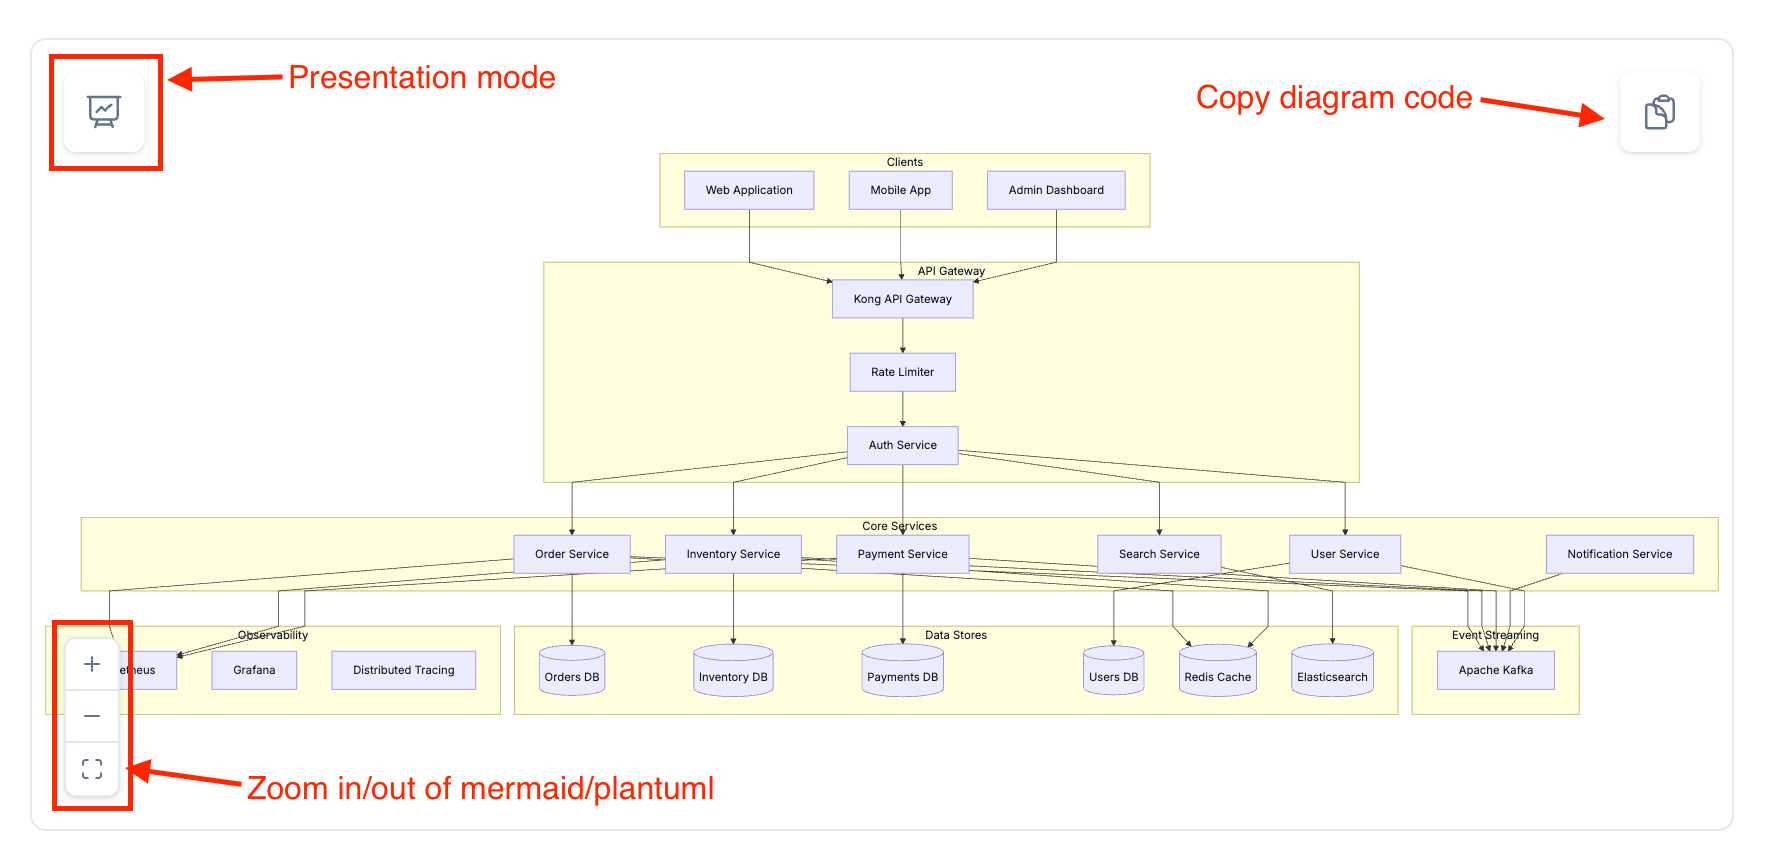
All mermaid and plantuml diagrams now include interactive controls for better viewing and exploration.
You can use the controls to zoom and pan around the diagram, and to copy the diagram code to your clipboard for your LLM tools.
Using diagrams with AI
Every diagram is available as markdown at a .mdx endpoint:
/diagrams/system-architecture/2.0.0.mdx
This follows the llms.txt convention, making your diagrams consumable by AI tools. Share the URL with ChatGPT, Claude, or any LLM that can fetch content.
With EventCatalog's built-in assistant, you can ask questions directly from the diagram page:
- "What services are shown in this diagram?"
- "Explain the flow between OrderService and PaymentService"
- "What would happen if Kafka went down?"
- "How does this compare to the previous version?"
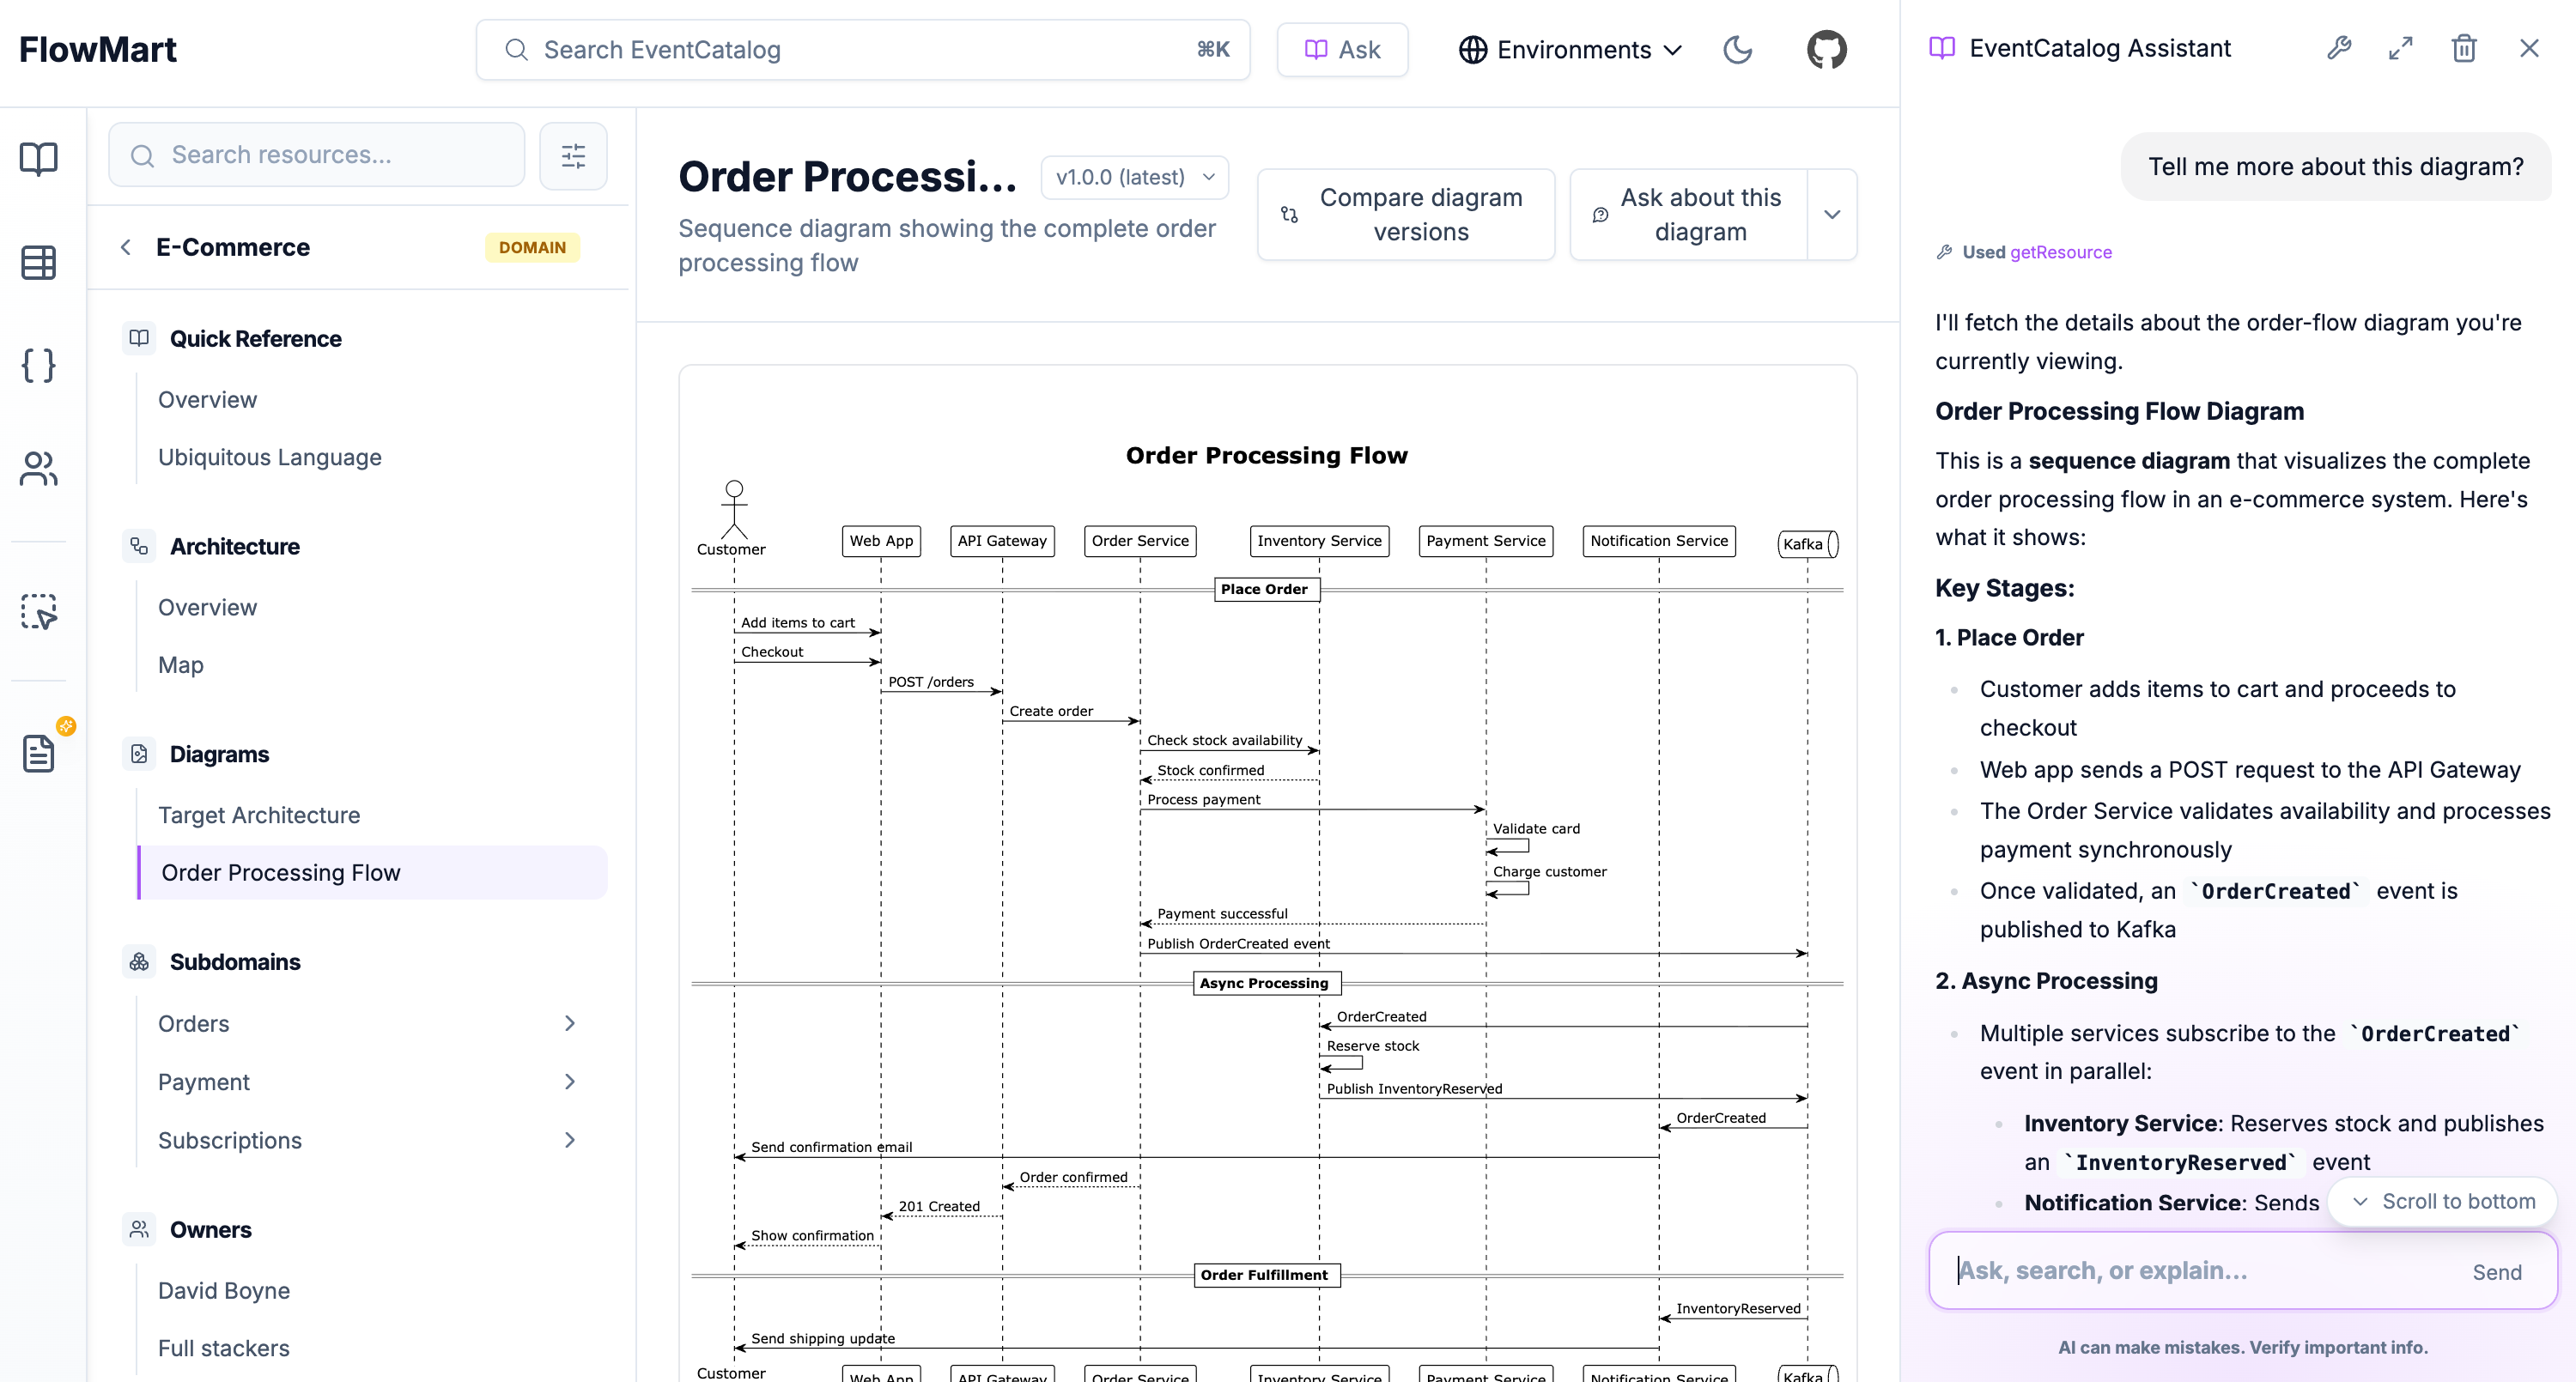 Using EventCatalog Assistant to ask questions about a diagram
Getting started
Upgrade to EventCatalog 3.4.1 or later.
npm install @eventcatalog/core@latest
Create a new diagram:
- Create a
/diagramsfolder in your catalog - Add your first diagram with
id,name, andversion - Reference it from your domains, services, or other resources
- Version it as your architecture evolves
That's it. Your custom diagrams now live alongside EventCatalog's auto-generated visualizations, giving you the complete picture: what your system looks like today and where it's heading.
Diagram SDK support is coming soon
Get started or check the diagrams documentation for more details.