Extend EventCatalog Assistant with custom tools to bring real-time metrics, service health, on-call information, and more into your architecture conversations
I'm excited to announce Custom Tools for EventCatalog Assistant, allowing you to extend the AI with your own integrations and bring real-time data directly into your architecture conversations.
Your documentation is valuable, but it only tells part of the story. With custom tools, you can now ask EventCatalog questions like "Is OrderService healthy?" or "Who's on-call for PaymentService?" and get answers based on live data from your production systems.
What is EventCatalog Assistant?
EventCatalog Assistant is the built-in AI chat interface that lets you have conversations with your architecture documentation. Ask questions about your events, services, schemas, and their relationships, and get instant answers.
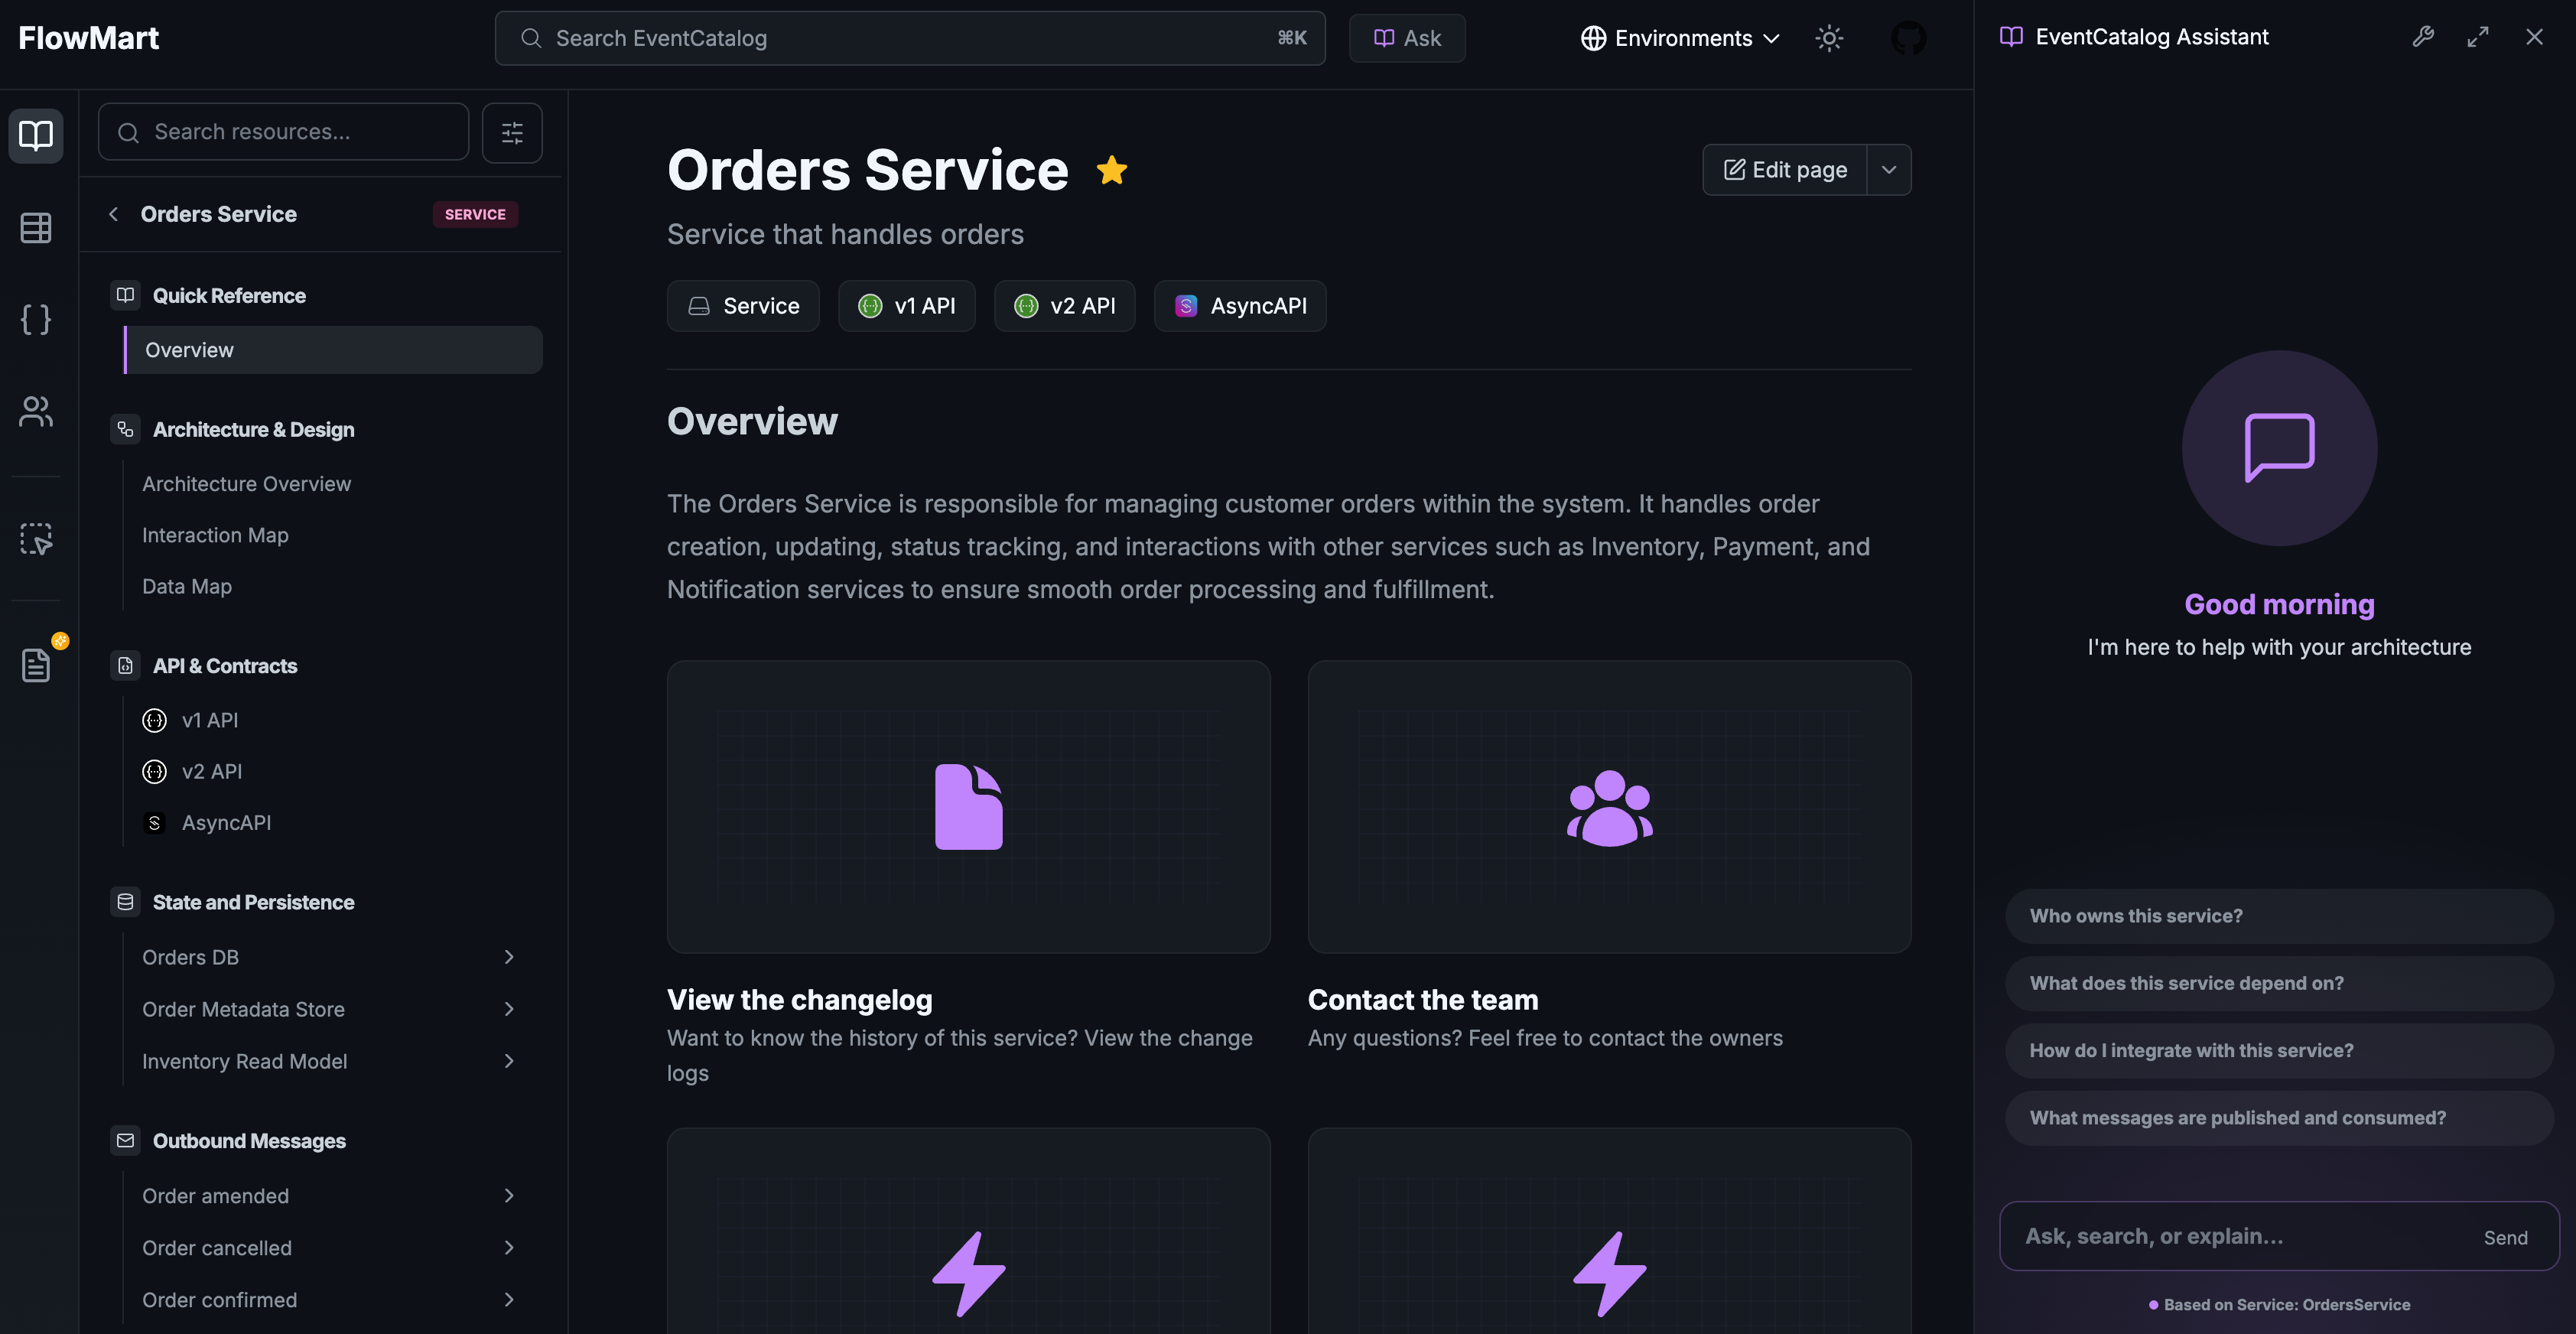 EventCatalog Assistant - Ask questions about your architecture documentation
With v3 of EventCatalog, the Assistant has been completely revamped with improved performance and a streamlined experience. And the best part? You bring your own model. Whether you prefer OpenAI (GPT-4), Anthropic (Claude), Google (Gemini), or any other provider supported by the Vercel AI SDK, you have full control over which model powers your conversations.
Now with custom tools, you can extend what the Assistant knows beyond your static documentation.
Beyond Static Documentation
EventCatalog has always been great at documenting your architecture: events, services, schemas, and their relationships. But developers often need more than static documentation. They need to know:
- Is this service actually healthy right now?
- What's the current throughput for this event?
- Who should I contact if something goes wrong?
- Are there any backlogs building up in the queue?
Previously, answering these questions meant switching between multiple tools: Datadog for metrics, PagerDuty for on-call schedules, Kafka UI for queue depths. Now, you can ask EventCatalog directly.
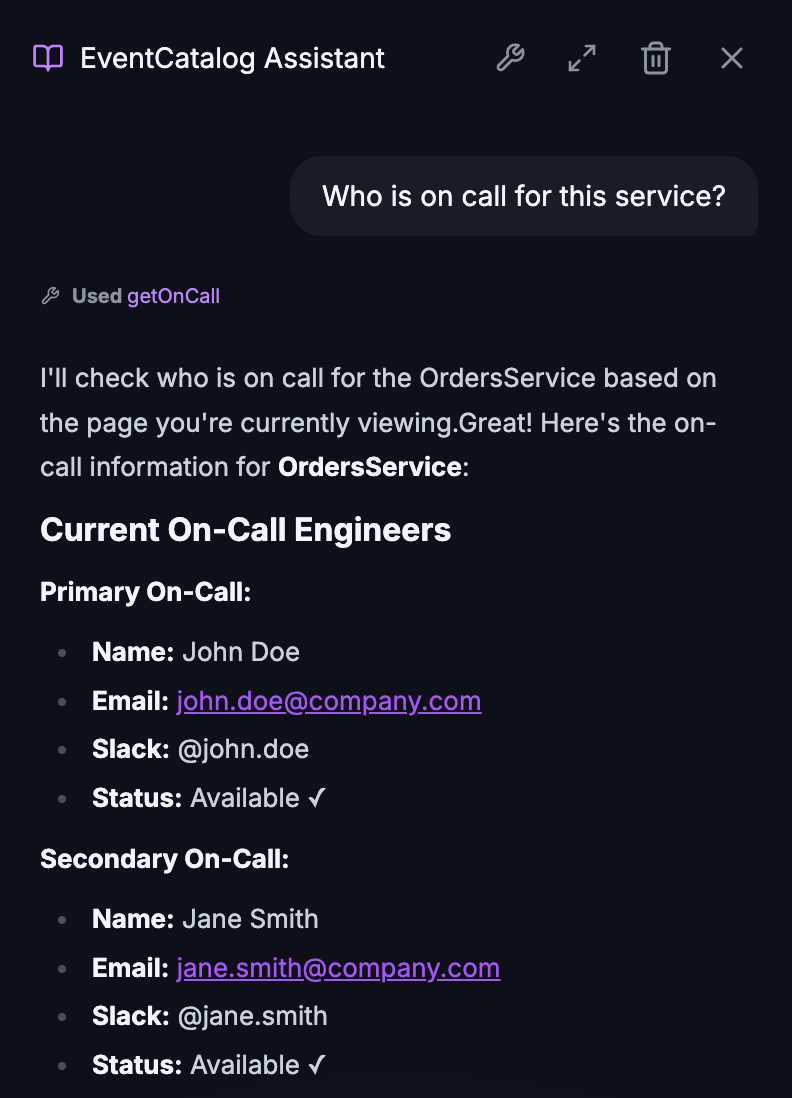 Calling custom tool to ask who is on call for a service
Every company has different systems and integrations. You might use Datadog or Prometheus for monitoring, PagerDuty or OpsGenie for on-call, Kafka or RabbitMQ for messaging. With custom tools, you can connect to any system and pull live information directly into your conversations. Your stack, your integrations, your data.
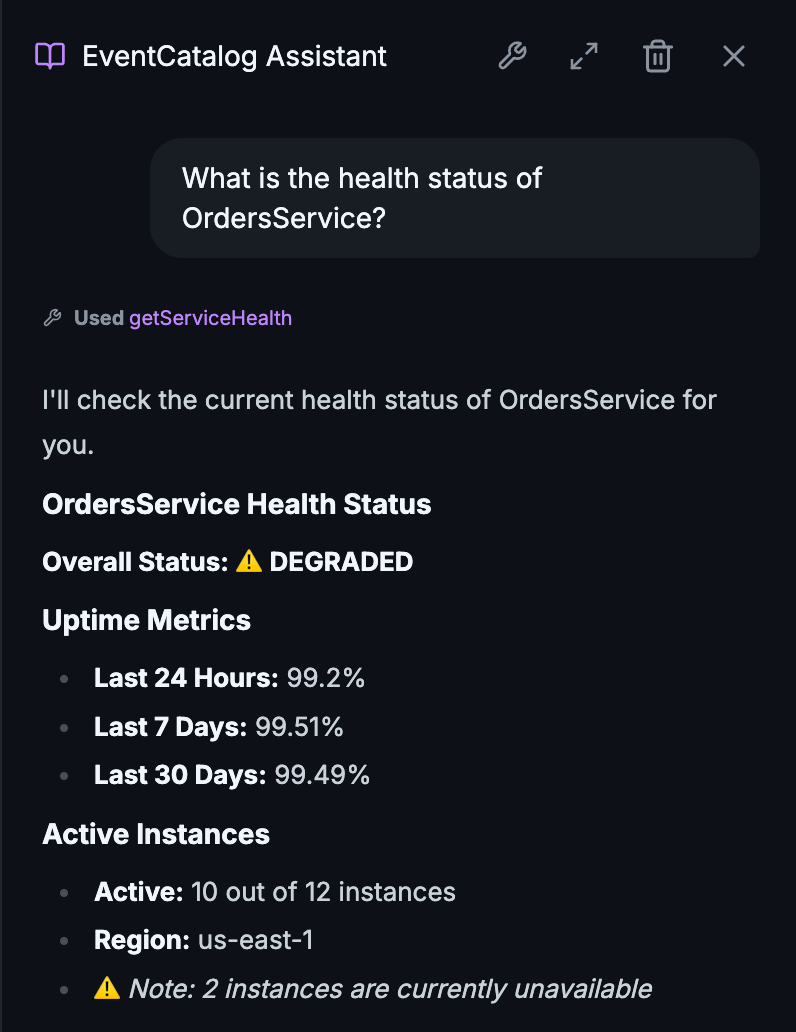 Calling custom tool for the health of a service
How It Works
Custom tools are defined in your eventcatalog.chat.js file. Each tool has a description that tells the AI when to use it, and an execute function that fetches the data.
import { anthropic } from '@ai-sdk/anthropic';
import { tool } from 'ai';
import { z } from 'zod';

export default async () => anthropic('claude-haiku-4-5');

export const tools = {
    getServiceHealth: tool({
        description: 'Get the current health status of a service. Use when users ask if a service is up or healthy.',
        inputSchema: z.object({
            serviceName: z.string(),
        }),
        execute: async ({ serviceName }) => {
            // Query your monitoring system
            const health = await datadogClient.getServiceHealth(serviceName);
            return {
                serviceName,
                status: health.status,
                uptime: `${health.uptime}%`,
                instances: health.activeInstances,
            };
        },
    }),
};
The AI automatically decides when to use your tools based on the user's question. Ask "Is OrderService healthy?" and the assistant will call your getServiceHealth tool, then use the response to provide a helpful answer.
Example Use Cases
Production Metrics
Connect to Datadog, Prometheus, or CloudWatch to answer questions about event throughput, latency, and error rates.
"What's the current throughput for OrderCreated events?"
On-Call Information
Query PagerDuty or OpsGenie to instantly find out who's responsible for a service.
"Who's on-call for PaymentService right now?"
Queue Health
Monitor Kafka, RabbitMQ, or SQS to detect backlogs before they become incidents.
"Are there any processing delays for InventoryUpdated events?"
Database State
Look up the current state of business entities directly from your databases.
"What's the current status of order #12345?"
A single pane of glass
The real power of custom tools is bringing everything together. Instead of switching between six different dashboards, developers can ask natural language questions and get comprehensive answers:
"Tell me about OrderService. Is it healthy, who owns it, and what's the current event throughput?"
EventCatalog combines your static documentation (architecture, schemas, relationships) with live operational data (metrics, health, on-call) to give complete answers.
Built for enterprise workflows
Custom tools open up possibilities for enterprise-specific integrations:
- Cost tracking - "How much did this event cost to process last month?"
- Compliance checks - "Does this service meet our SLA requirements?"
- Incident history - "What incidents has this service had this quarter?"
- Deployment info - "When was this service last deployed?"
- Schema validation - "Would this schema change break any consumers?"
Whatever internal systems your team relies on, you can now surface that information through EventCatalog's conversational interface.
How to get started
Custom tools are available on Scale and Enterprise plans (get a 30-day free trial at EventCatalog Cloud).
To get started:
- Enable the chat feature in your
eventcatalog.config.js(see documentation) - Create your tools in
eventcatalog.chat.js - Restart EventCatalog and start asking questions
Check out the complete documentation for detailed examples and best practices.
Join the Community
Have questions about custom tools or want to share what you've built? Join our Discord community. We'd love to hear your ideas and see your implementations.
Custom tools transform EventCatalog from a documentation site into a living knowledge hub. Your architecture documentation combined with real-time operational data, all accessible through natural language.
Try it today and let us know what you think.