Visualize your catalog
In this step, you will use EventCatalog visualizations to understand the model you created.
Visualizations help people see how systems connect. They grow as your catalog grows, so the same view can start with one event relationship and later include domains, commands, queries, flows, channels, data stores, agents, and other architecture primitives.
In this chapter...
Here are the topics we'll cover
- Use NodeGraph inside documentation pages.
- Use the Visualizer to explore the catalog map.
- Export visualizations to Mermaid when you need to share or edit them elsewhere.
Use NodeGraph on a page
The NodeGraph component can be added to domain, service, message, changelog, and custom documentation pages.
Add it to a resource page like this:
<NodeGraph />
When used without props, NodeGraph renders a visualization for the current page. For example, on the OrderPlaced page it can show the event, the service that publishes it, and the service that consumes it.
You can also render a graph for a specific resource:
<NodeGraph id="E-Commerce" version="0.0.1" type="domain" />
This is useful when you want the visualization to appear directly next to the documentation people are reading.
Use the Visualizer
The Visualizer is the full map view in EventCatalog. It gives you more room to explore how resources connect across your catalog.
Open the OrderPlaced map from the event page. You should see:
OrderServicepublishesOrderPlaced.InventoryServiceconsumesOrderPlaced.- the relationship between the producer, event, and consumer.
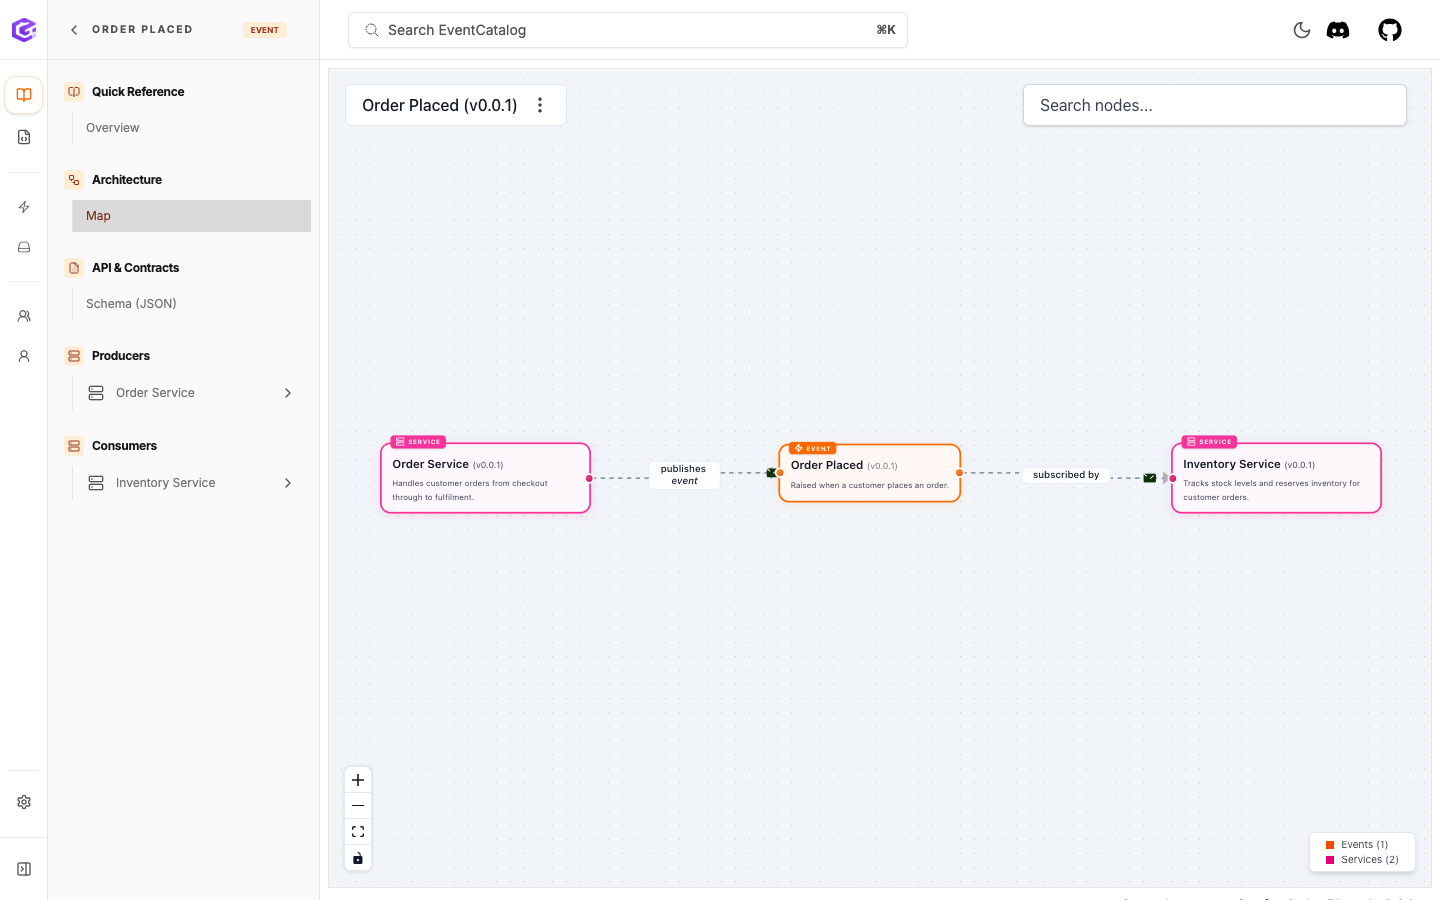
The OrderPlaced map shows the producer, event, and consumer relationship.
Now open the E-Commerce domain map. The domain only references the services, but the map can still show the event relationship between them.
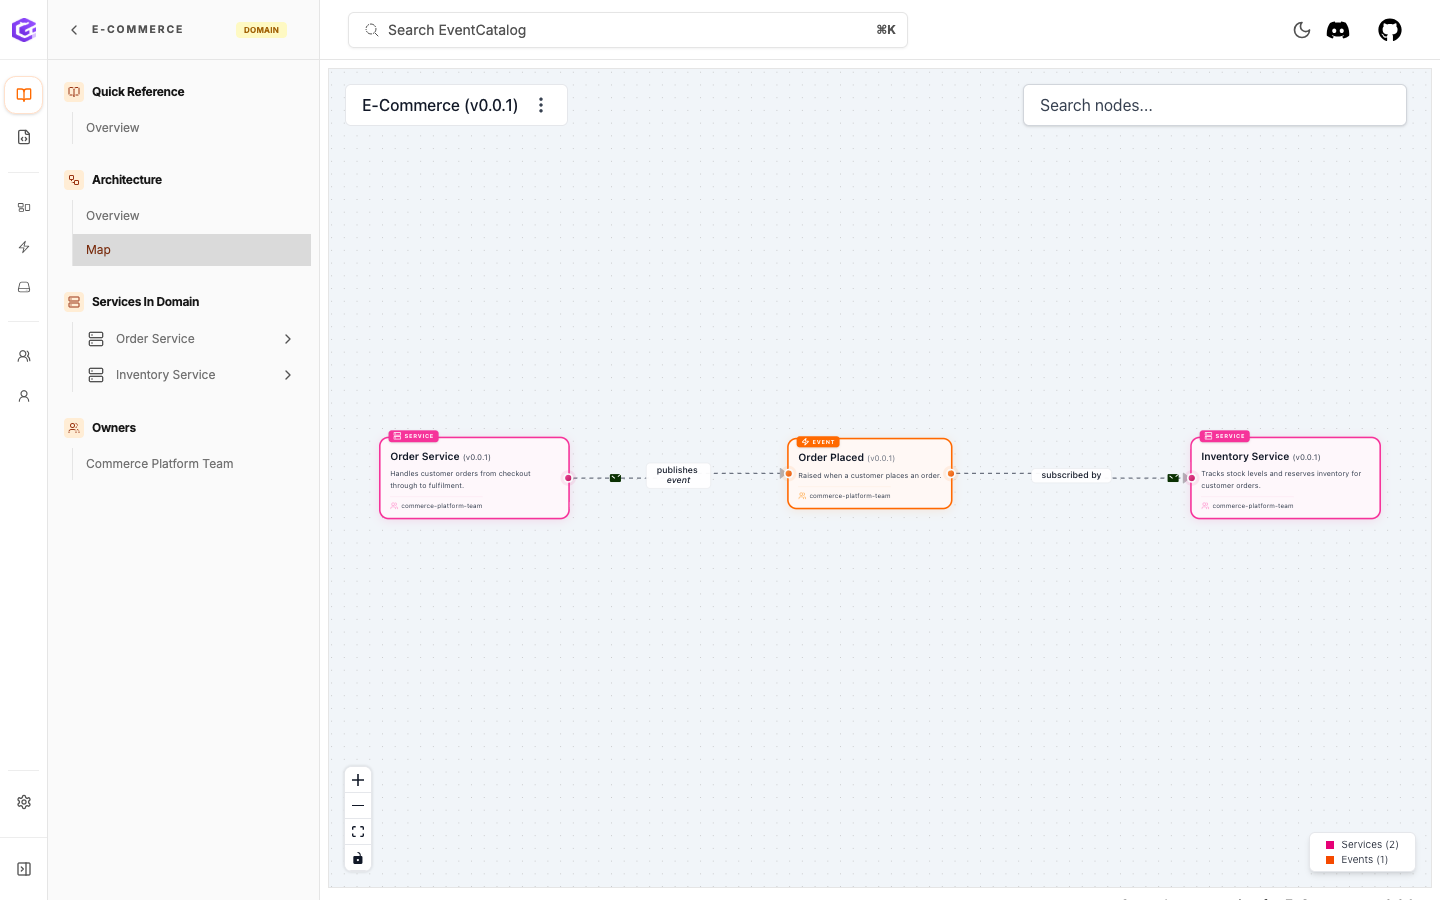
The E-Commerce domain map gives a focused view of the services in that part of the architecture.
Export to Mermaid
NodeGraph visualizations can be switched to Mermaid view or copied as Mermaid diagram code. This is useful when you want to share the architecture with another tool, paste it into documentation, or give it to an AI assistant for review.
You can learn more in the NodeGraph docs and the Mermaid docs.
What you have now
You can use EventCatalog to:
- embed visualizations directly inside documentation pages
- explore the wider catalog with the Visualizer
- see events between systems
- understand how services, domains, ownership, and messages connect
- export visualizations as Mermaid when you need to use them elsewhere
As you add more resources, these visualizations become more useful. Commands, queries, domains, flows, channels, data stores, agents, and extra services can all add more context to the map.
Next
Continue to Build and deploy your catalog.