
We are happy to announce that the new visualiser feature has been released 🎉.
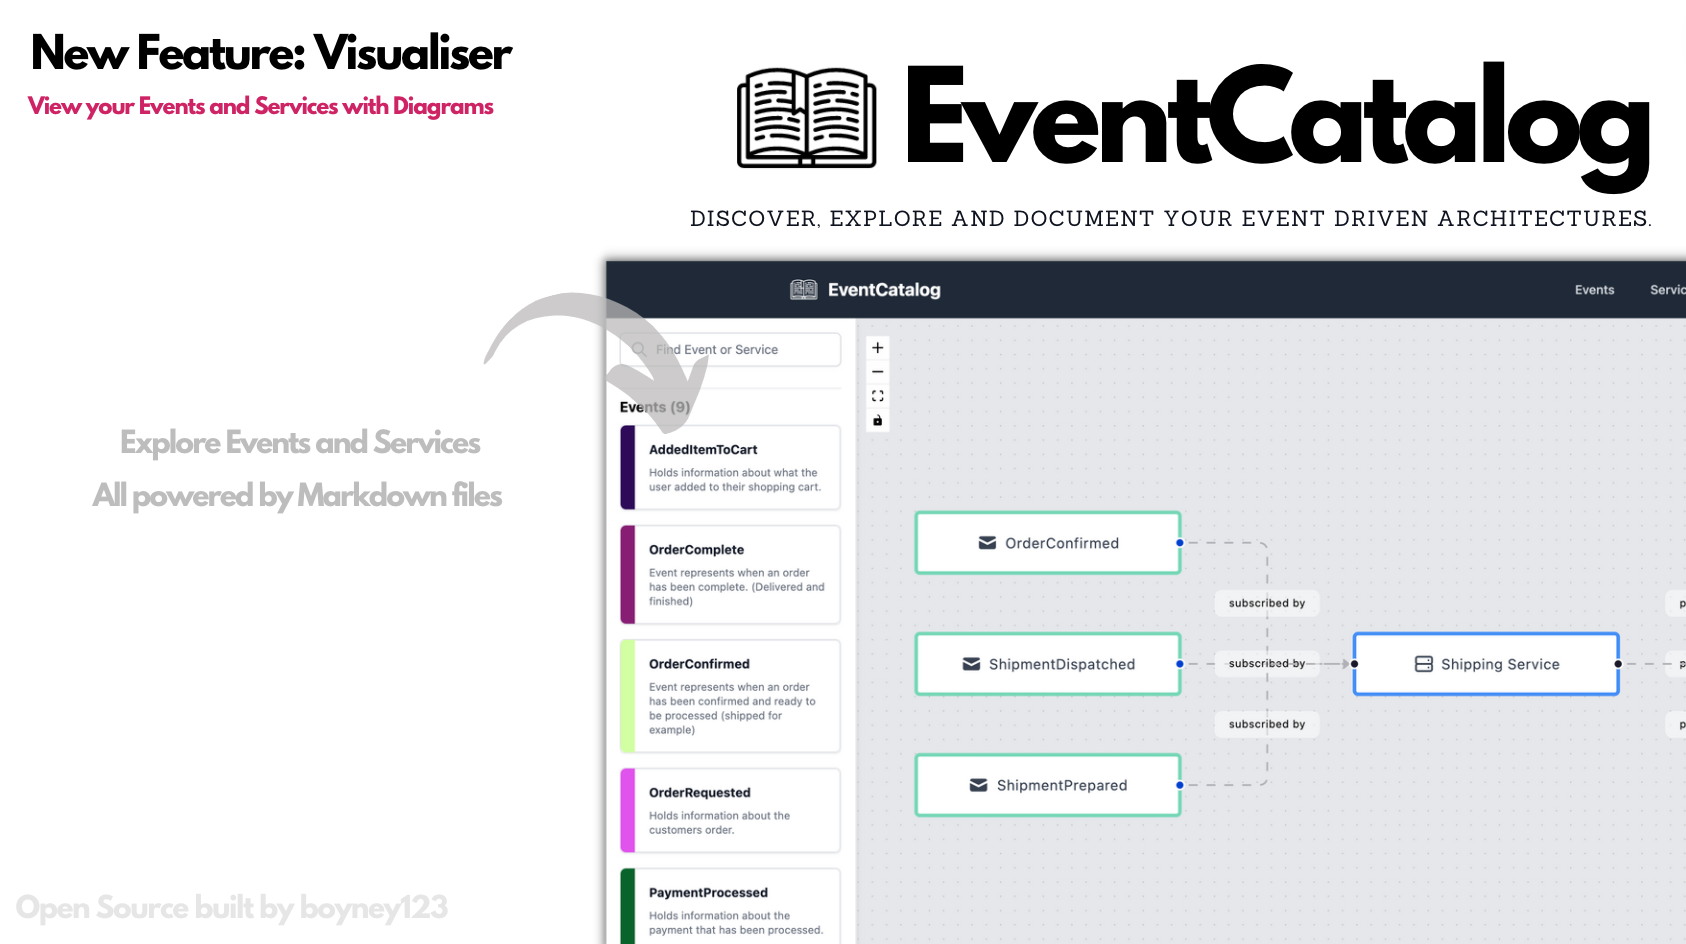
The visualiser allows you to see the relationships between all events, publishers and subscribers.
EventCatalog is focused on making Event Architecture documentation simple and useful. With the visualiser you will be able to understand the relationships between all your events and services.
Want to see the Demo? You can view it here: https://app.eventcatalog.dev/visualiser/
How does the visualiser work?
EventCatalog is powered by markdown files. Everything you see within the catalog is information written and stored within your markdown files. The visualiser parses your markdown files, understands the relationships between your events and services and can render node graphs based on your architecture.
If you want to add or remove publishers or subscribers you can simply edit your markdown files and instantly see the changes in your diagrams.
How can you get started?
If you already have EventCatalog simply upgrade your @eventcatalog/core package to the latest and navigate to your visualiser. (new item in the navigation bar).
If you have yet to try EventCatalog head over to our getting started guide, where you can get a catalog started within minutes using our NPM packages.
Summary
EventCatalog has only been out over a month so far and we have a great community providing feedback and using the catalog.
The visualiser feature was designed to help you and your team document your architectures and provide visual help to do that.
If you have any ideas or feedback feel free to raise an issue on GitHub or come join us on Discord.
Special thanks to Thim for making this feature possible with the introduction to Node Graphs without our MDX Components.
Enjoy!