Create a diagram
EventCatalog Diagrams let's you bring your own diagrams into your Catalog.
Creating a diagram
Automatic Creation
Copy this prompt and paste it into your coding agent. Your agent can help you choose where the diagram should live, create the right folder structure, and add the first version of the diagram documentation.
Manual Creation
Diagrams live in a diagrams folder. EventCatalog discovers any index.mdx file inside a diagrams directory, regardless of where that directory lives in your catalog.
You can place diagrams:
At the root of your catalog:
Inside a domain:
Inside a service:
Organize diagrams close to where they're most relevant. System-wide diagrams can be placed at the root level, while resource-specific diagrams should live within that resource's folder.
Create the diagram file
Create an index.mdx file for the diagram.
Here is an example of a system architecture diagram:
---
id: system-overview
name: System Overview
version: 1.0.0
summary: High-level architecture showing all microservices and their interactions
---

## System Architecture

This diagram shows our microservices architecture:

\`\`\`mermaid
graph TB
    subgraph "Frontend"
        WebApp[Web Application]
        MobileApp[Mobile App]
    end

    subgraph "Backend Services"
        Gateway[API Gateway]
        OrderService[Order Service]
        PaymentService[Payment Service]
        InventoryService[Inventory Service]
    end

    subgraph "Data Layer"
        OrderDB[(Orders DB)]
        PaymentDB[(Payments DB)]
        Kafka[Event Stream]
    end

    WebApp --> Gateway
    MobileApp --> Gateway
    Gateway --> OrderService
    Gateway --> PaymentService
    OrderService --> Kafka
    PaymentService --> Kafka
    OrderService --> OrderDB
    PaymentService --> PaymentDB
\`\`\`

### Key Components

- **API Gateway**: Single entry point for all client requests
- **Order Service**: Handles order creation and management
- **Payment Service**: Processes payments and refunds
- **Event Stream**: Kafka for asynchronous communication
Example with PlantUML
---
id: order-flow
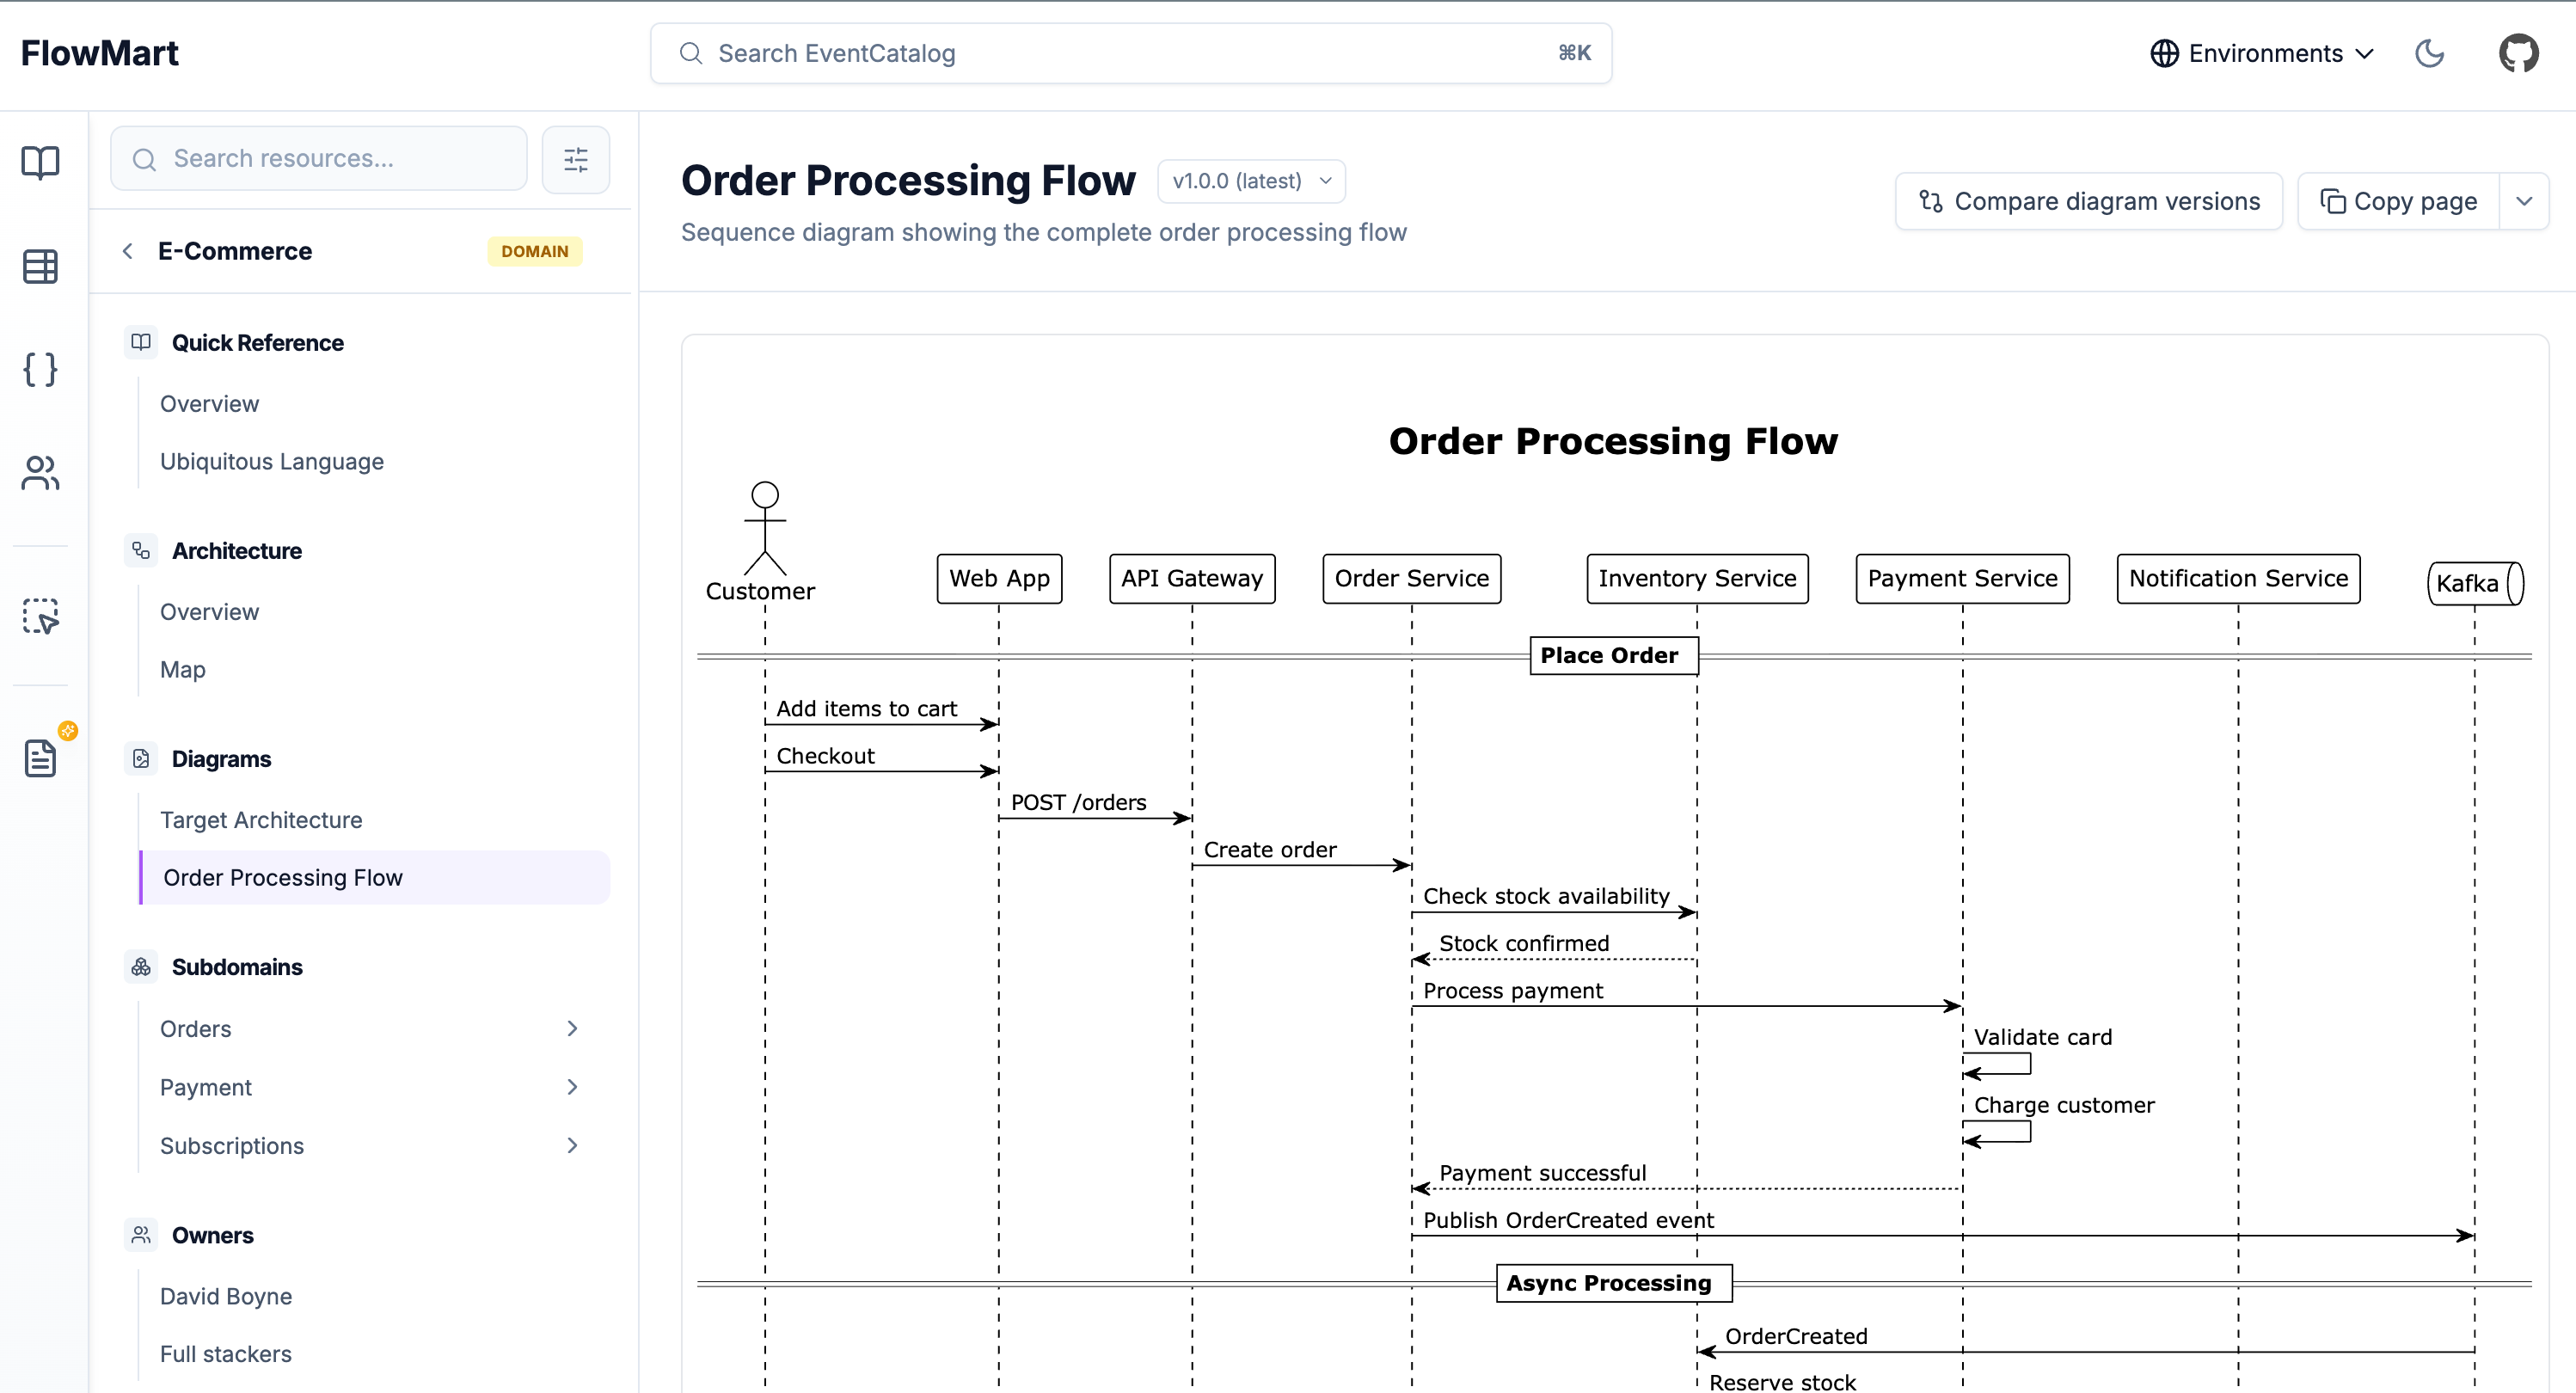
name: Order Processing Flow
version: 1.0.0
summary: Sequence diagram showing the complete order processing flow
---
\`\`\`plantuml
@startuml
actor Customer
participant "Order Service" as Order
participant "Payment Service" as Payment
participant "Inventory Service" as Inventory
Customer -> Order: Create Order
Order -> Inventory: Check Stock
Inventory --> Order: Stock Available
Order -> Payment: Process Payment
Payment --> Order: Payment Confirmed
Order --> Customer: Order Confirmed
@enduml
\`\`\`
## Order Processing Flow
This sequence diagram illustrates the order processing workflow:
1. Customer initiates order creation
2. Order service validates inventory availability
3. Payment is processed
4. Order confirmation is sent to customer
Example with embedded diagram
EventCatalog provides built-in components to embed diagrams from popular tools like Miro, IcePanel, Lucidchart, draw.io, and FigJam. This lets you bring your existing collaborative diagrams directly into your catalog.
---
id: architecture-overview
name: Architecture Overview
version: 1.0.0
summary: Miro board showing our system architecture and design decisions
---

<Miro embedUrl="https://miro.com/app/board/..." />

## Architecture Overview

This Miro board captures our architecture decisions and system design.
Key areas covered:

- System context
- Container architecture
- Component relationships
- Technology choices
Check out the Diagrams documentation to see all available diagram syntax and embed components including <Miro>, <IcePanel>, <Lucid>, <DrawIO>, and <FigJam>.
Next steps
Once you've created diagrams, you can:
- Reference them from resources like domains, services, and messages
- Compare diagram versions side-by-side