See your system as it actually works.
Stop guessing how services connect. See every dependency and message flow across your entire system.
Generated from your documentation, not drawn by hand.
Always up to date.


You can't change what you can't see.
When every service, event, and dependency is visible in one place, teams stop guessing and start shipping with confidence.
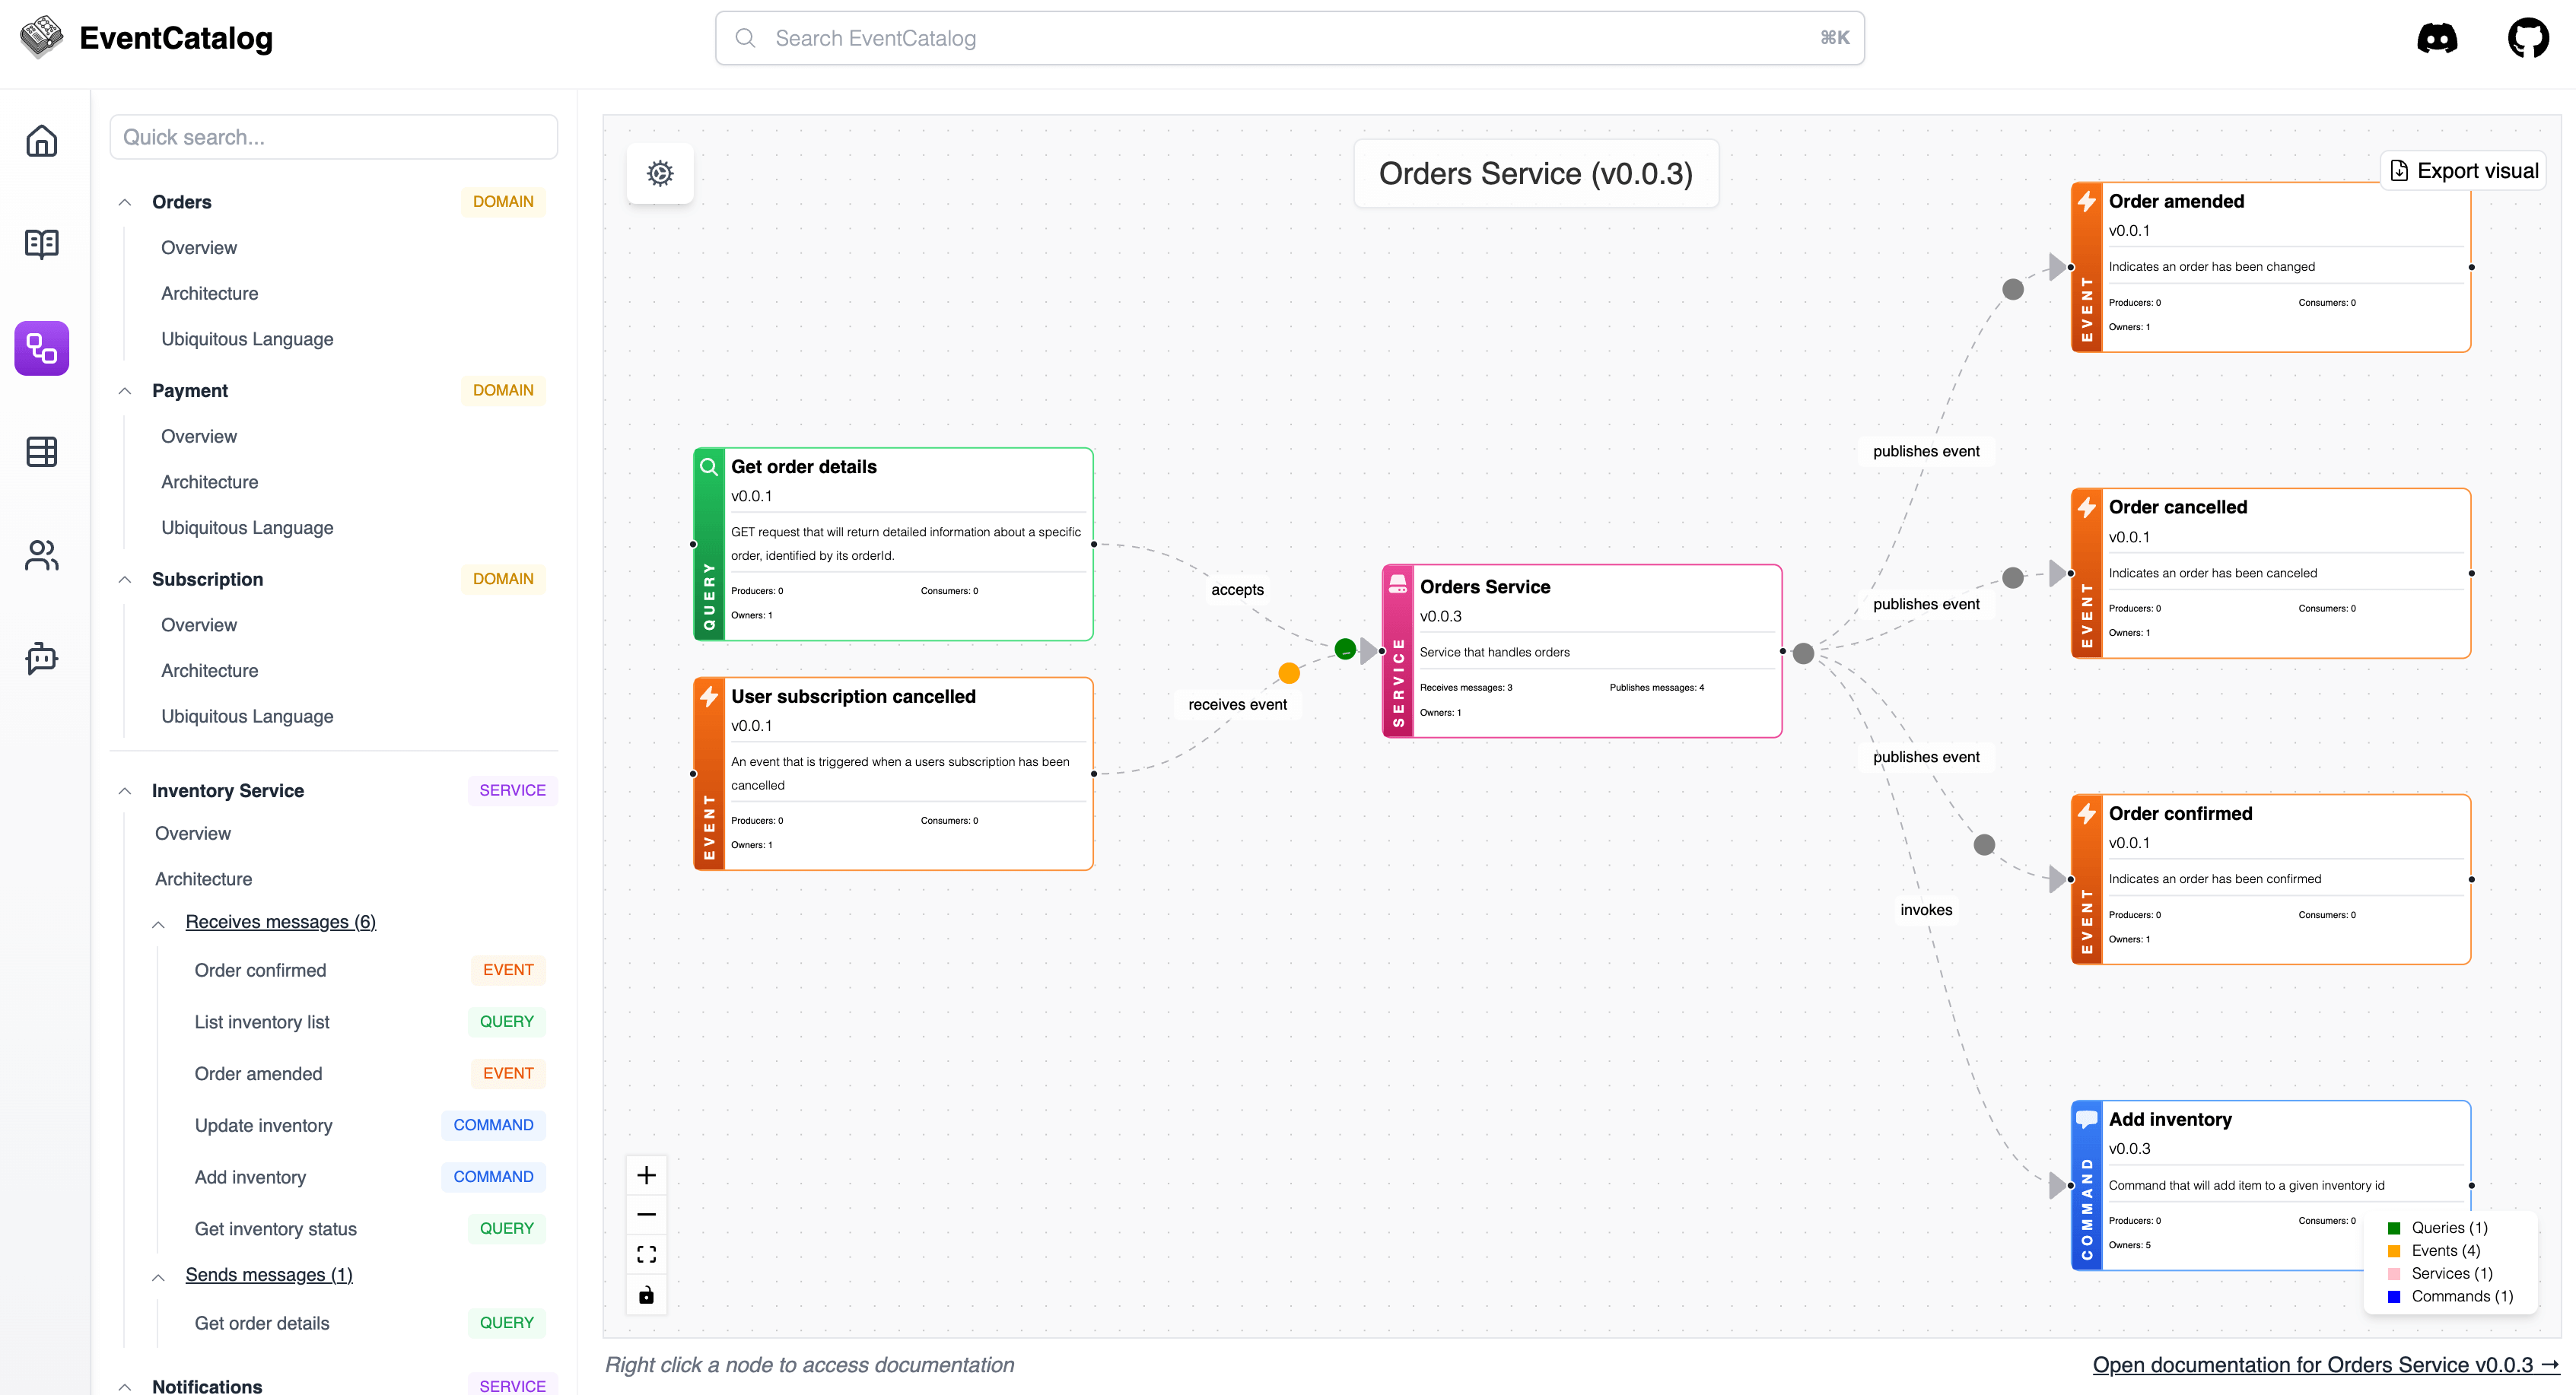
Your architecture, mapped automatically
Generated from your documentation, not drawn by hand.
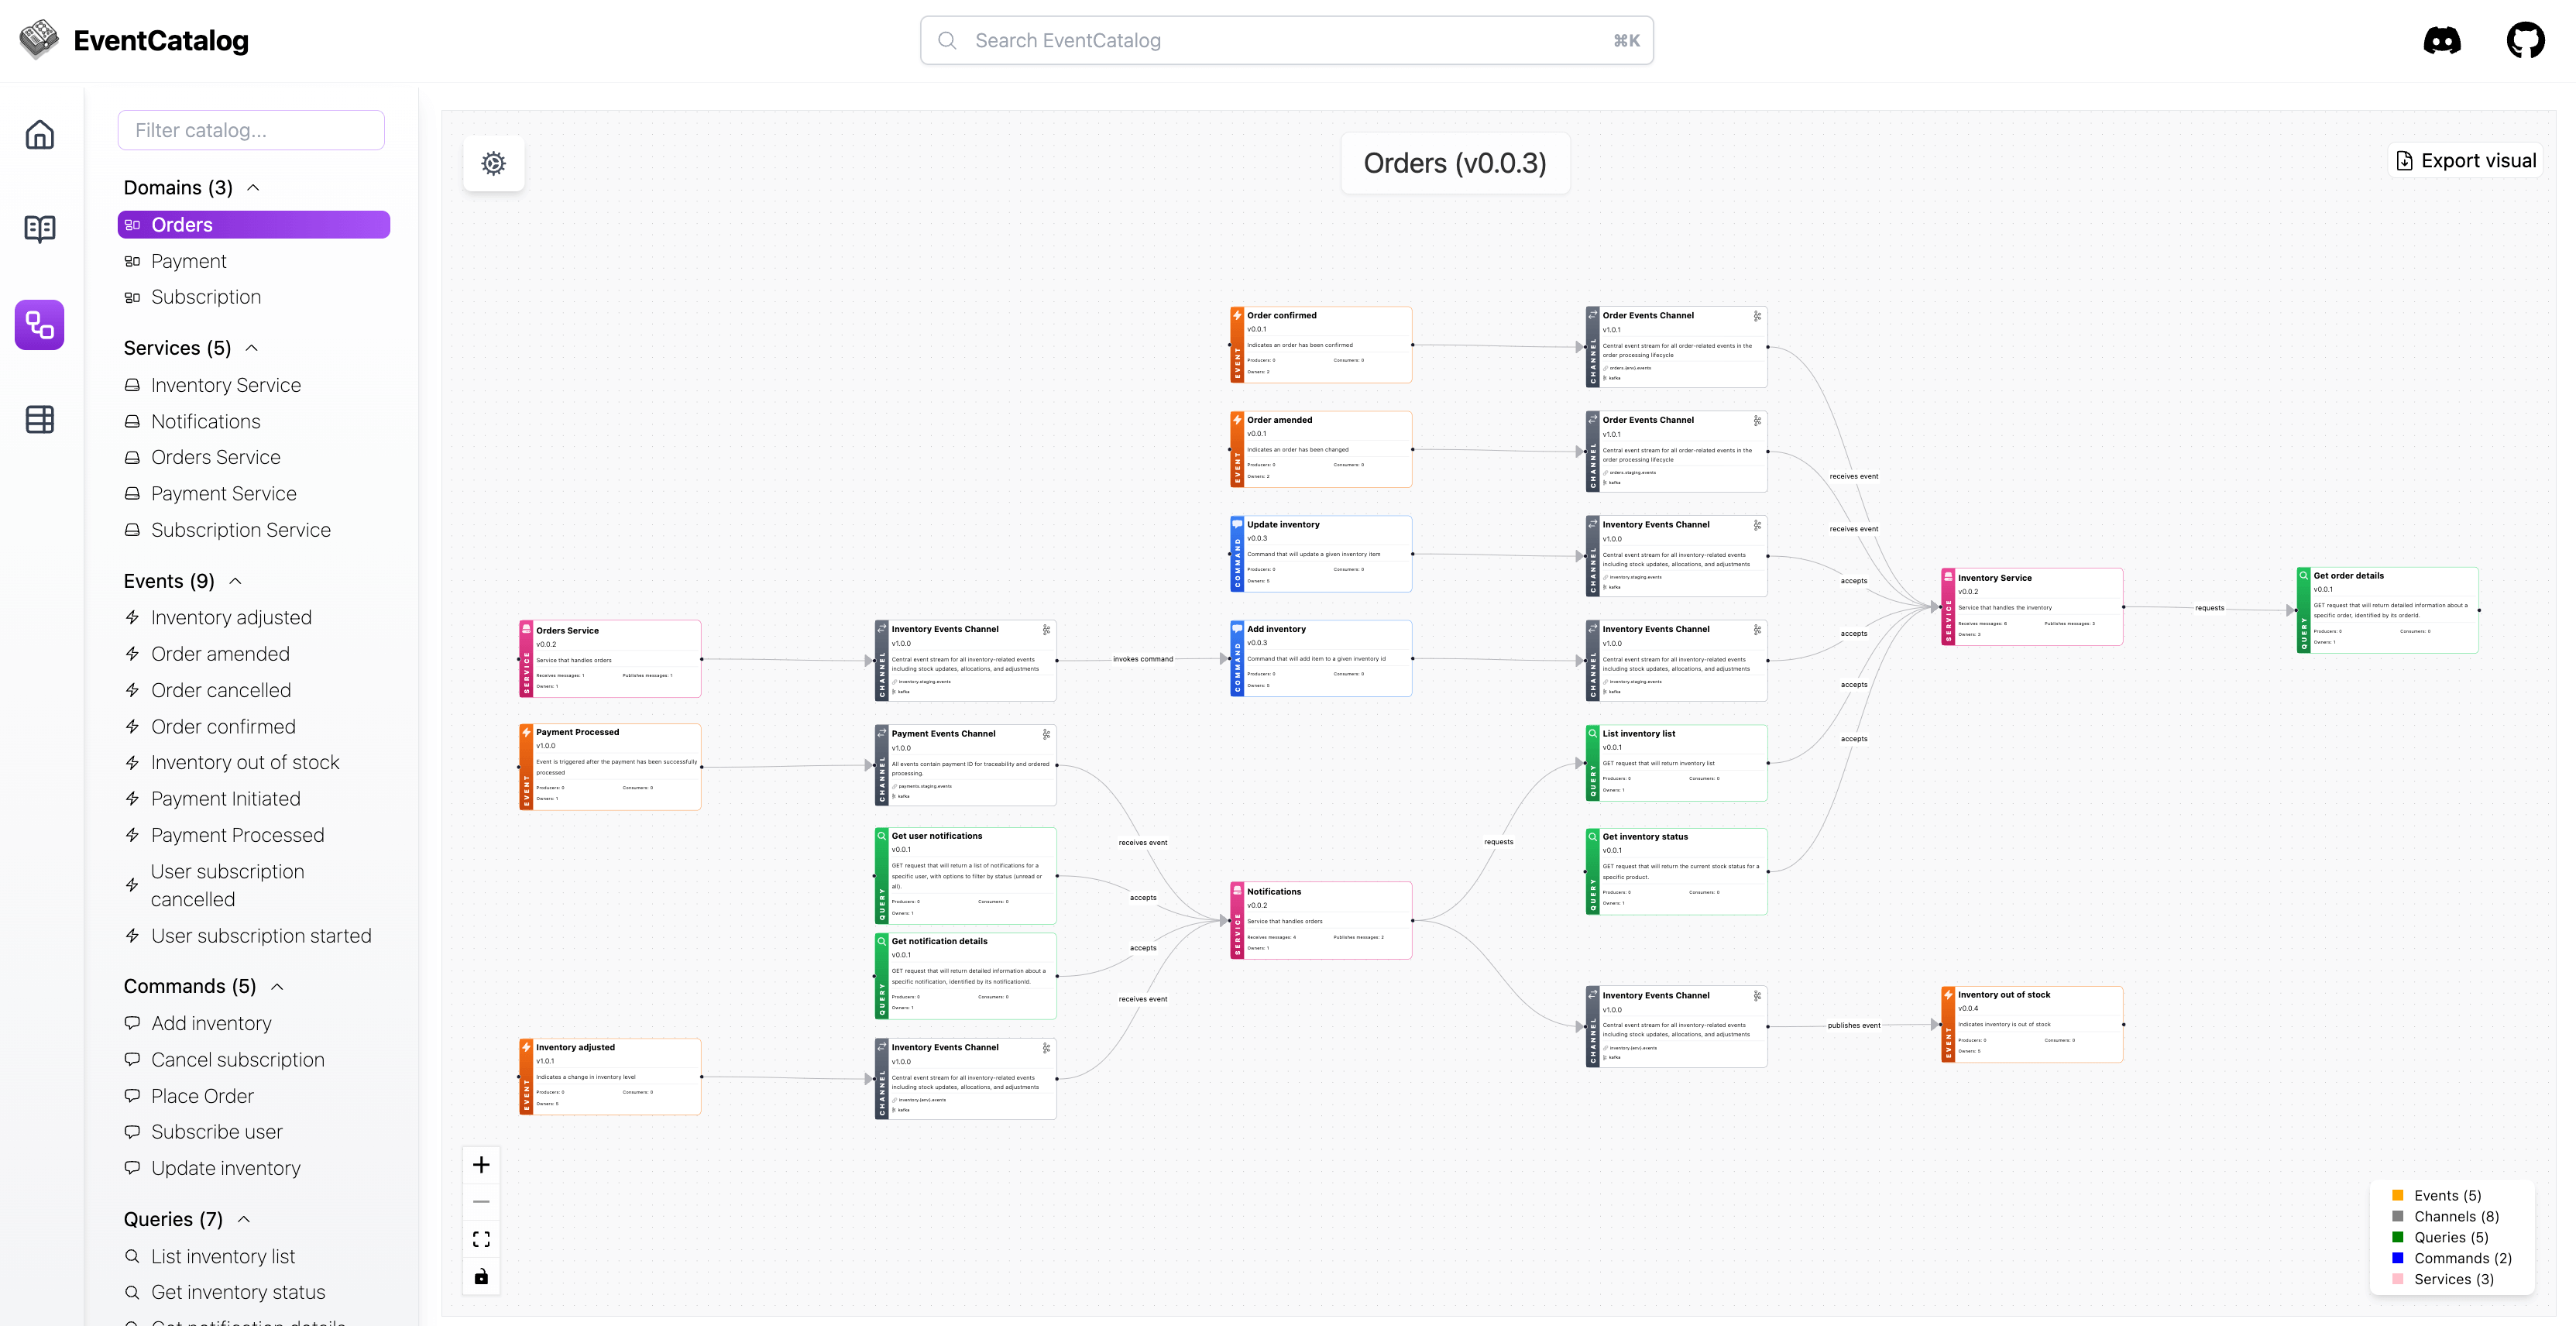
Domains, services, and messages in one view
Start with the full picture, then drill into any domain, service, or message to see owners, schemas, and downstream dependencies.
Explore message flows
Trace how messages move between services. See what's downstream before you ship a change.
From visualization to design
Export any visualization to EventCatalog Studio to model new services, events, and boundaries before you build them.
Embed in your documentation
Drop live visualizations into any service or event page. They update when your catalog does.
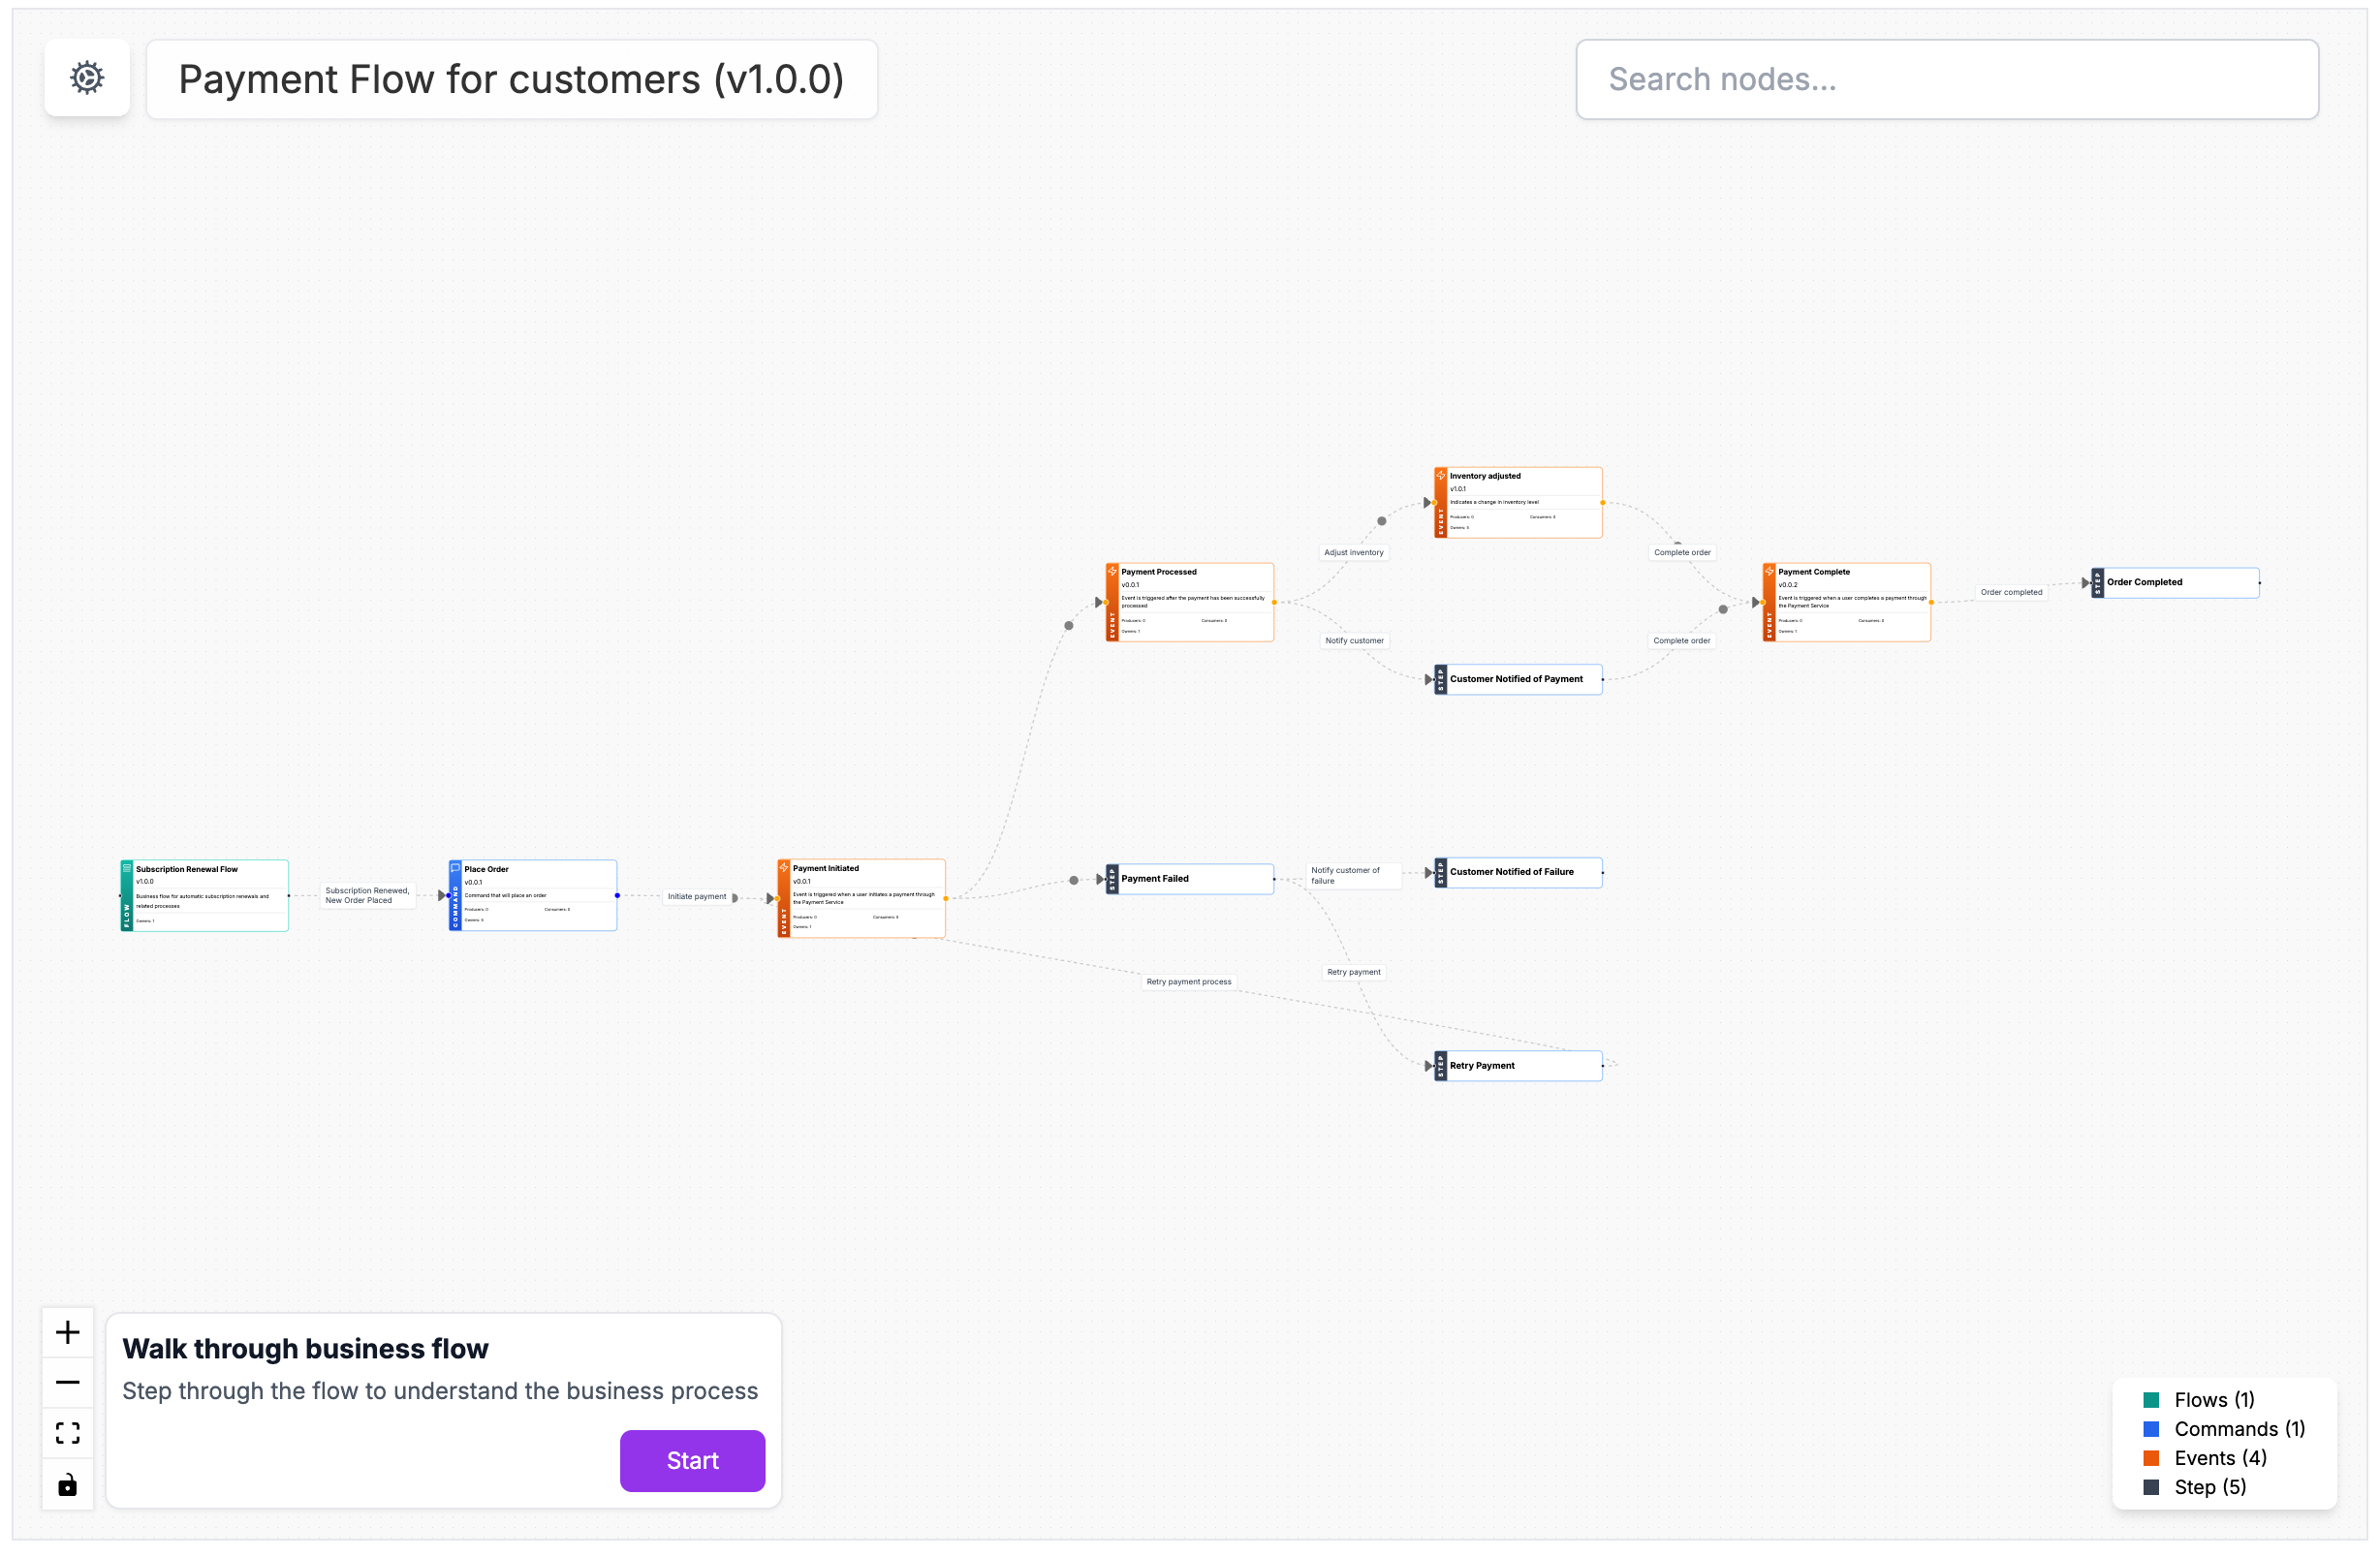
Visualize business flows, end to end
Connect events to business value
Events don't exist in isolation. Use flows to show how they fit into checkout, onboarding, payment processing, and the other processes your business runs on.
More than just your services
Flows include users, external APIs, third-party systems, and everything else that touches a business process.
Flows live inside your docs
Embed flow visualizations directly in service or event pages, so the context is always right next to the diagram.
PMs see the process. Engineers see the plumbing.
PMs trace the business process. Engineers trace the services and messages underneath. One visualization serves both.
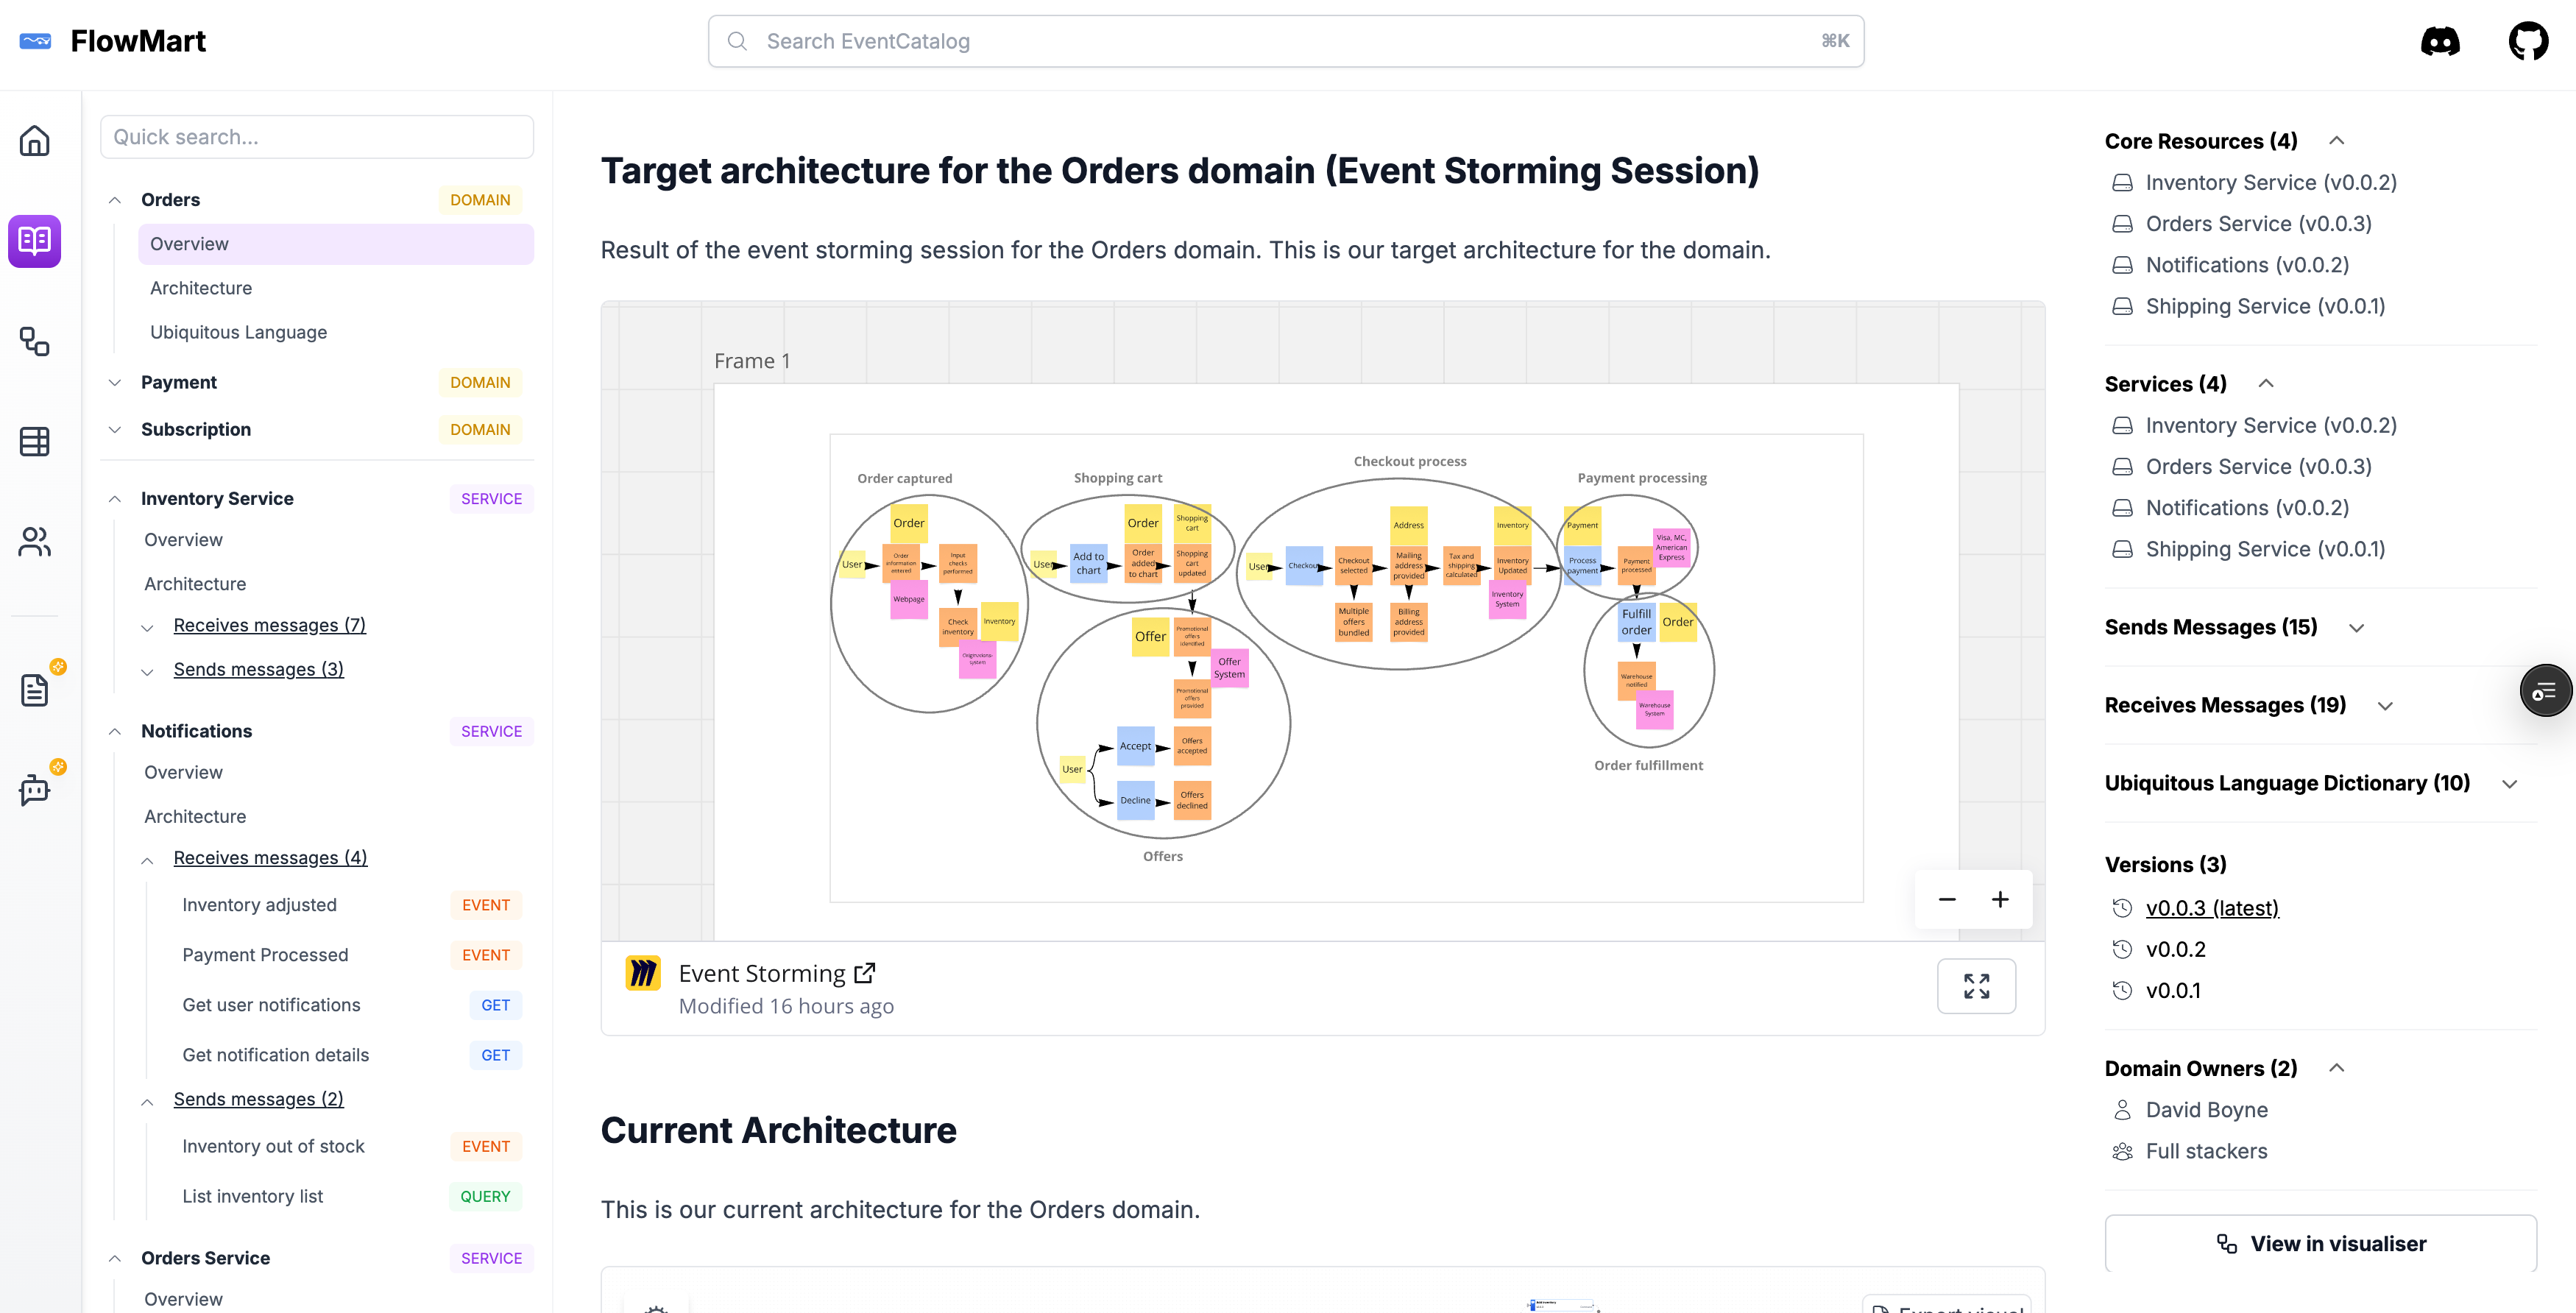
Your diagrams, versioned and discoverable
Keep diagrams next to the docs that explain them
Diagrams sit alongside the services, events, and schemas they describe. Versioned in Git, discoverable by search.

Edit in Miro, see it in EventCatalog
Embed live Miro boards directly in your architecture docs. Changes sync automatically.
AI tools can read your diagrams
Because diagrams are linked to real services and events, AI tools can explain flows and dependencies, not just display an image.
Bring any diagram tool
Mermaid, PlantUML, Draw.io, C4, or custom SVGs. If you can export it, you can version it in EventCatalog.
Automate visualizations


Start for free
Join the teams behind 31,000+ catalogs
Self hosting documentation and governance for your organization.