# Inputs and outputs
Copy as Markdown[View as Markdown](/docs/development/guides/data-products/inputs-and-outputs.md)
***
**Added in** `eventcatalog@3.8.0`
Data products consume inputs (e.g events, services, data stores, channels) and produce outputs (e.g events, services, data stores, channels). Defining these relationships helps teams understand data lineage and dependencies.
## Defining inputs (input ports)[](#defining-inputs-input-ports "Direct link to Defining inputs (input ports)")
Inputs represent the source dependencies your data product consumes. In EventCatalog these can be [events](/docs/development/guides/messages/events/introduction.md), commands, queries, [services](/docs/development/guides/services/introduction.md), [data stores](/docs/development/guides/data/introduction.md), or [channels](/docs/development/guides/channels/introduction.md).
You need to specify the `id` of the input and optionally the `version` of the input. If no version is provided the latest version will be used.
```
---
id: order-analytics
name: Order Analytics
version: 1.0.0
# Define input dependencies
inputs:
- id: OrderConfirmed
- id: PaymentProcessed
- id: FraudDetectionService
- id: payment-cache
- id: payment-domain-eventbus
---
```
## Defining outputs[](#defining-outputs "Direct link to Defining outputs")
Outputs represent what your data product produces. These can be events, commands, queries, services, data stores, or channels.
You need to specify the `id` of the output and optionally the `version` of the output. If no version is provided the latest version will be used.
```
---
id: order-analytics
name: Order Analytics
version: 1.0.0
# Define what this data product produces
outputs:
- id: OrderMetricsCalculated
- id: NotificationService
- id: orders-db
- id: orders-domain-eventbus
---
```
## Visualizing relationships[](#visualizing-relationships "Direct link to Visualizing relationships")
The `` component automatically visualizes inputs and outputs.
```
```
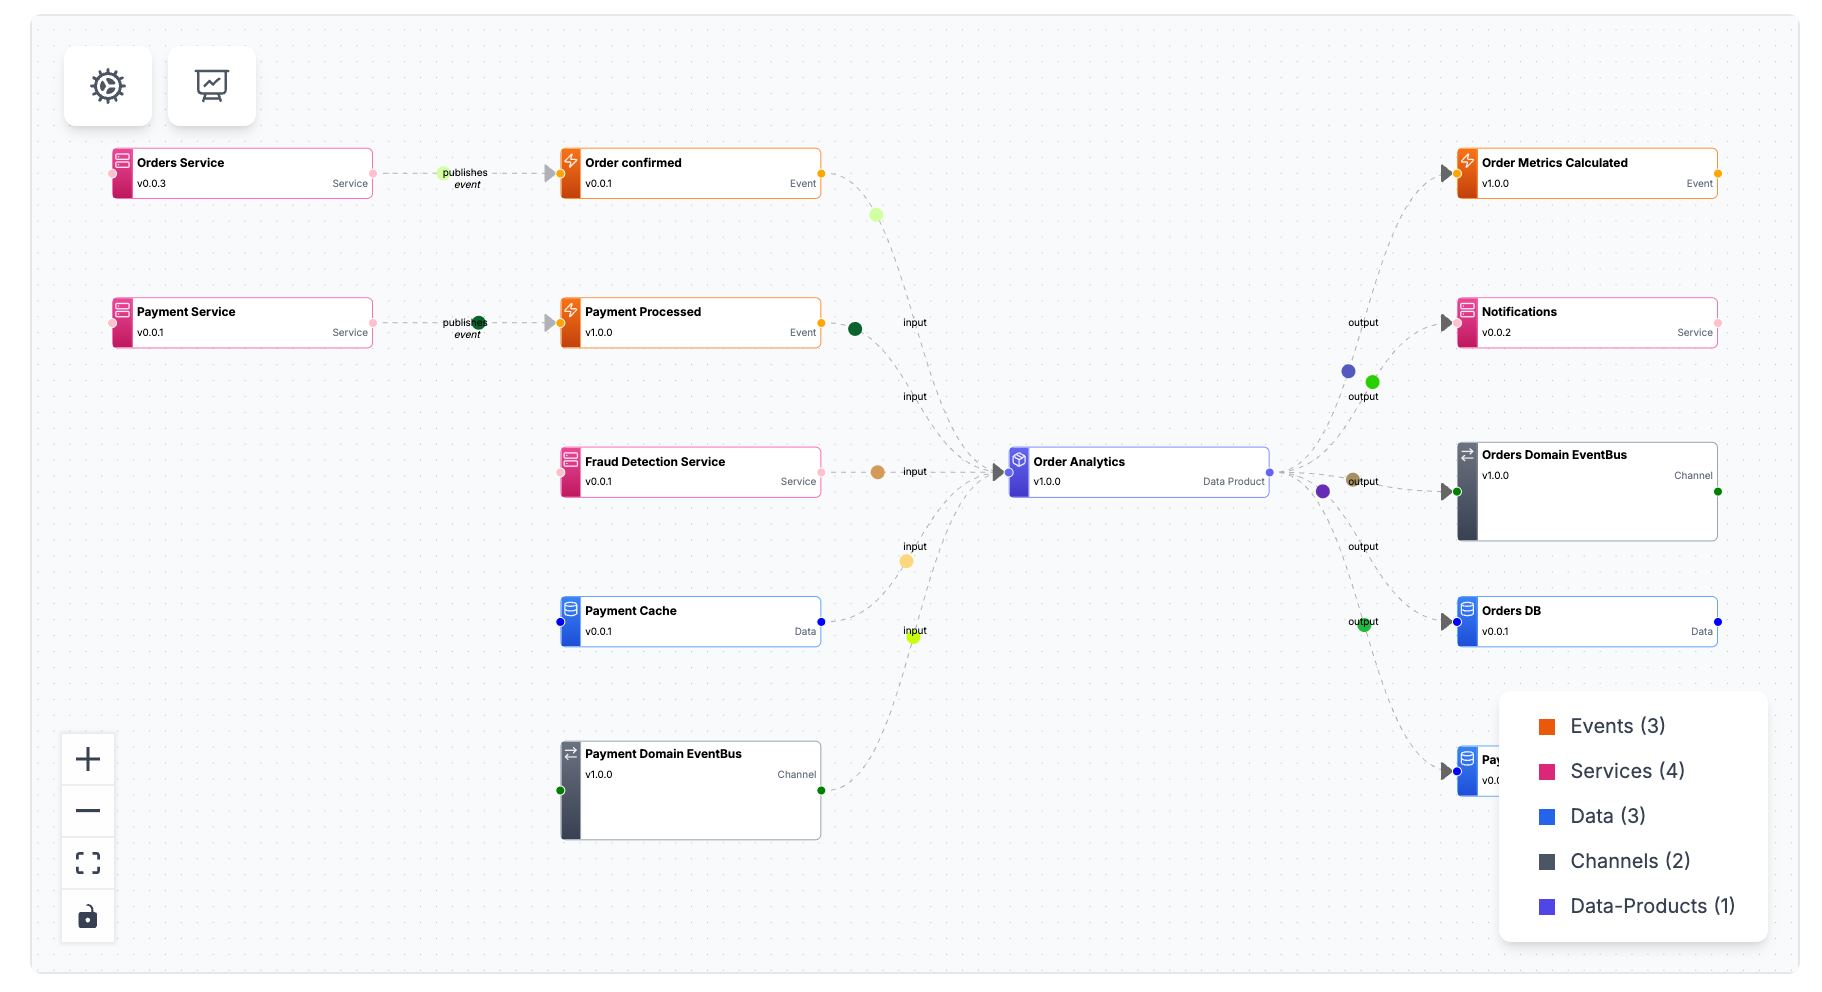
This graph shows:
* Input events flowing into the data product
* Output events or data stores produced
* Services that interact with the data product
* Contract relationships for data stores
## Complete example[](#complete-example "Direct link to Complete example")
/data-products/PaymentAnalytics/index.mdx
```
---
id: payment-analytics
name: Payment Analytics
version: 1.0.0
summary: Payment performance metrics and fraud insights
inputs:
- id: PaymentInitiated
- id: PaymentProcessed
- id: PaymentFailed
- id: FraudCheckCompleted
- id: PaymentService
- id: payments-db
outputs:
- id: NotificationService
- id: payment-domain-eventbus
- id: payment-analytics-db
contract:
path: payment-metrics-contract.json
name: Payment Metrics Contract
type: json-schema
---
## Overview
Payment Analytics transforms payment lifecycle events into comprehensive metrics.
## Input Events
- **PaymentInitiated** - Start of payment flow (~60k/day)
- **PaymentProcessed** - Successful payments (~55k/day)
- **PaymentFailed** - Failed transactions (~5k/day)
- **FraudCheckCompleted** - Fraud detection results (~60k/day)
## Output Tables
### fact_payments
Transaction-level payment data with fraud scores.
```
## Next steps[](#next-steps "Direct link to Next steps")
* [Add schema contracts](/docs/development/guides/data-products/contracts.md)
* [Version data products](/docs/development/guides/data-products/versioning.md)
* [Add to domains](/docs/development/guides/data-products/adding-to-domains.md)